
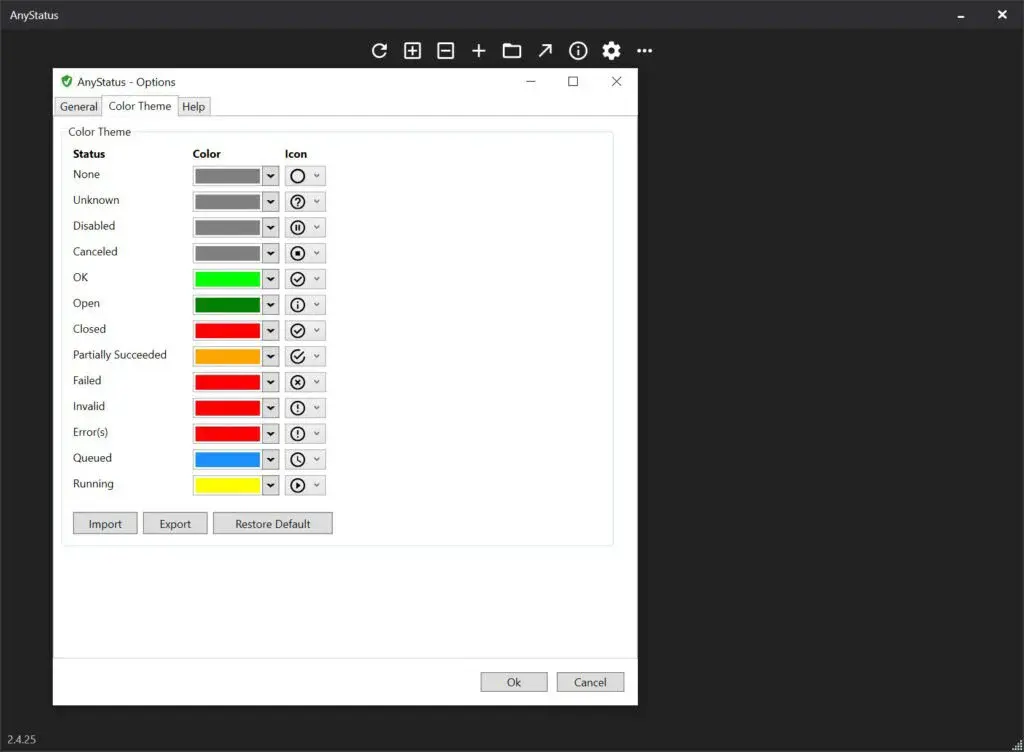
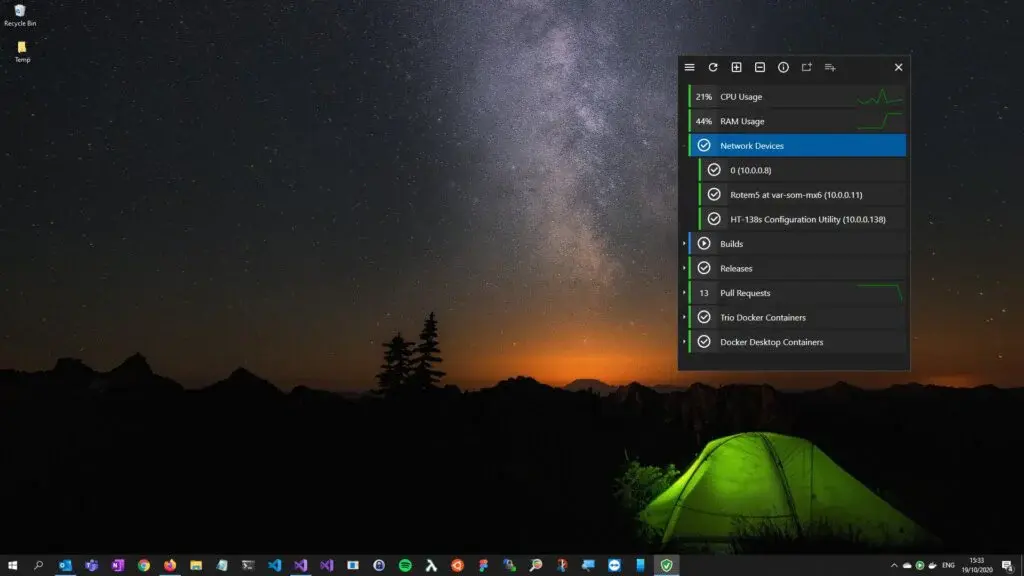
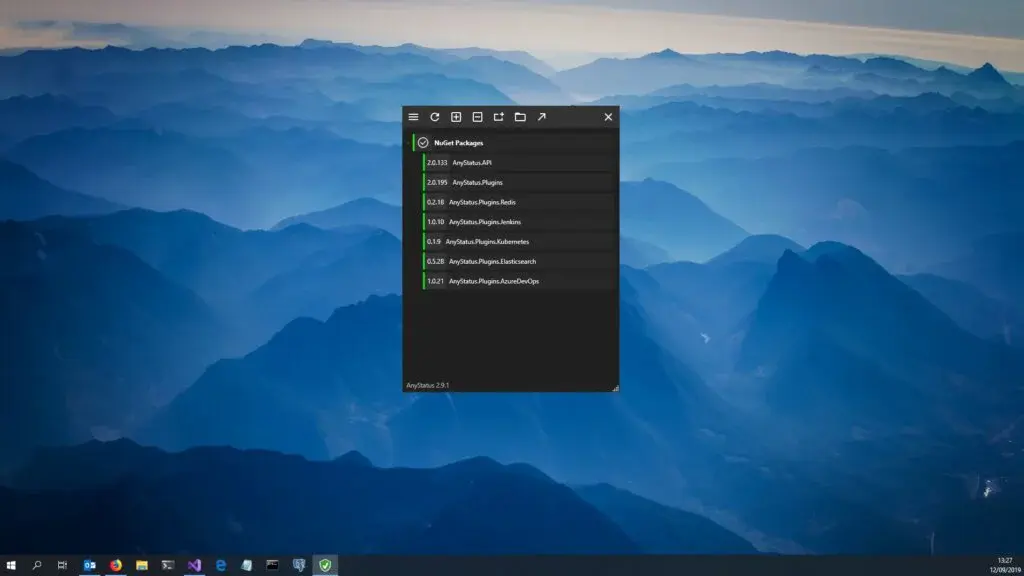
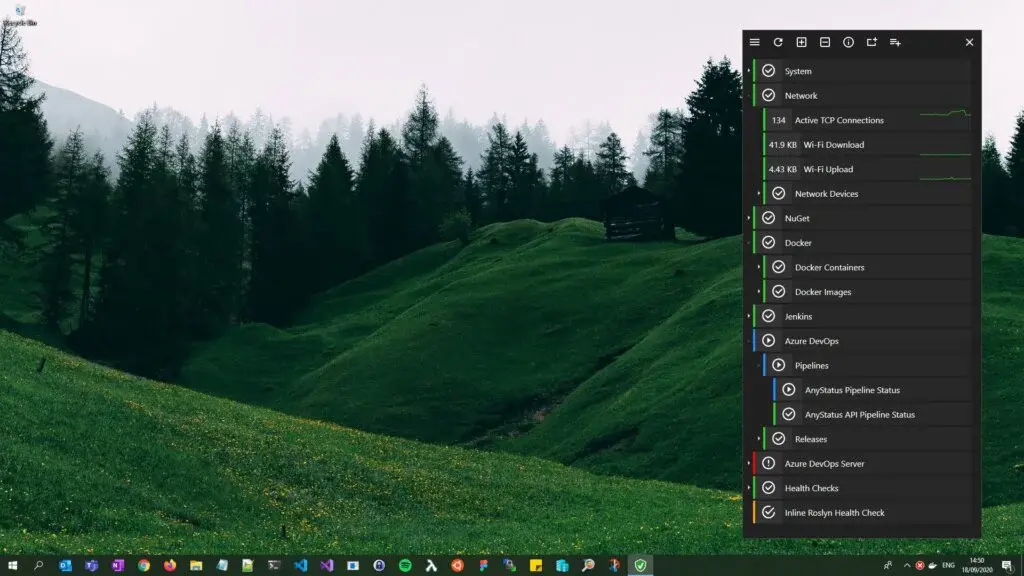
AnyStatus is an application available for the Windows platform which allows the user to easily get updated information and data in one place. This application collects all the information from many sources and screens and displays it on one dashboard allowing the user to conveniently observe the current status of the whole device and take actions accordingly. It is a perfect application providing an intuitive and user-friendly interface along with many other features and functionalities creating even more convenience for the user.
It is an Open-source application only available for Windows operating system till now providing services free of cost to the users. Another appreciated feature of this application is its integration ability to other applications and platforms like Microsoft Azure, Jenkins, Docker, Binance, and many more. This application can be downloaded from the Microsoft Windows store without any cost.

NetCrunch is an application available for the Windows platform which allows the user to easily keep the data and status of the desktop PC. This application presents all the updated information and real-time stats of the PC in one place for the convenience of the user allowing him to per4form actions and operations according to the received data. This is a very useful application that provides every single minor to major detail about the devices including peripheral (input/output) devices as well as the network connectivity.
It is a must-have application for persons who want to be real-time updated on every moment about the status of the Desktop PC. They can easily use that information for their own convenience, For example, they would know easily if they need to close an application or shut down a process if it is taking many resources. This application can help the user a lot in improving the process of PC.

Freshping is a cloud-based service that facilitates the user by providing updated and real-time data of the websites and web applications. This application provides accurate data and information covering every single aspect including uptime, downtime, performance reports, global checks, monitoring of HTML/HTTPS URLs, Web Sockets, Ping, TCP, UDP as well as DNS.
This application is a perfect tool to keep a keen eye on the performance of the web application by taking and reviewing the reports momentarily. Another appreciated feature of this tool is its easy-to-understand user-friendly interface which allows even the beginner user to easily interact with it and manage the web application in no time. It is a paid service and can buy from the official website on a monthly as well as annual basis.

Curler by Amixr.IO was a cloud-based service that facilitates the user by providing updated information and data from the web application. In fact, it is a website monitor application that facilitates the user by providing the information including the uptime, downtime, ping, security certificates, DNS services, and many more. This service is now overtaken by another company called Amixr but right now this service is unavailable due to some reason.
This application gets the information and current status of the website once every 10 minutes and updates the user via an email or notification on Dashboard if everything is going all right or not. This is a completely free-of-cost service that is trusted and being used by hundreds of organizations and people for their professional purposes. The interface provided here is also one of the appreciated features due to its seamless and effective actions.
Xymon is a cost-effective monitoring system that is specially designed for the Linux-like operating system, enabling the developers to monitor the entire activities within the system in a single click. It provides tools that can be used to monitor for potential problems, including sending alerts when problems arise. It is utilized by the IT professional, system administrator, or network administrator who needs to monitor one or more systems in the enterprise.
You can use it to monitor servers ranging in complexity from standalone systems to large enterprise installations. It can run on either a server or a workstation, although it is usually installed on one host only. The clients are responsible for sending data to Xymon’s central monitoring daemon (s). A single host can have multiple clients if more than one network interface is available to communicate with the daemon.

Datadog is one of the effective cloud monitoring services that lets you monitor your servers, applications, databases, and others. It is written in Perl, works with most modern Unix-like operating systems, and uses the client-server model of networking. It listens for client requests on one or more network interfaces and then processes those requests by gathering information from the localhost and/or servers. The daemon then evaluates this information against a set of rules that you write, and all the evaluation is performed by the plugins.
Alerts can be sent to users and/or other hosts upon detecting a problem. There can be multiple instances of the daemon running on different hosts; this allows you to monitor your infrastructure using several different machines, which increases the reliability and availability of your system. Another function of this platform includes it can be used for fault monitoring, performance monitoring, or security monitoring and has the ability to detect possible problems before they become crises.

AppOptics is one of the classical application monitoring or service management platform that comes with out-of-the-box monitoring tools and a non-complex dashboard. The agent is a small standalone program that can collect various metrics from a system, aggregate them into data sets, compute basic statistics on these data sets and report them back to the master. The idea behind app monitoring is that you can monitor your application and automatically detect issues and potential bottlenecks.
AppOptics is fully compatible with both batch and continuous monitoring functionality, allowing you to set up an alert on specific areas where you can find more information on some other useful features such as caching or deep linking. With the help of its powerful monitoring tool, it monitors applications and detects performance issues by analyzing performance data over time.

Monitive is an award-winning external monitoring service that is specially designed to keep an eye on your website or server and detects downtime in seconds. It will alert you when something goes wrong, and the best part is that it only takes a 10 min set up and run in the background of your day-to-day. The interesting function of this platform includes it gives you real-time alerts on the different processes such as processes that use too much disk & memory, any exceptions within your application, if the correct packages are installed or not, and many others.
Monitive monitors your applications automatically and lets you know when something goes wrong and identifies performance issues and crashes. It provides a great opportunity to identify bottlenecks and scalability problems before they occur so you can scale up faster and deliver more value to your users.

Firemon is a rich-featured network that is utilized by the top leading enterprises or professional developers, enabling them to monitor the background running processes and eliminate the unnecessary process in seconds. It is the only solution that allows you to create an agile network security policy platform within minutes. You can now manage all of your security policies in one central location, with automated deployment into your gateway controllers for no additional work on your part.
The core feature of this platform includes you can create and deploy your network security policies in minutes, granularly define the scope of the policy as well as exactly which devices it applies to, automatically deploy your FireMon policies into your gateway controller for no additional work on your part. It solves the problem by creating a centralized policy management platform that allows you to manage your policy data once and deploy it to each of your network security devices.

LibreNMS is a user-friendly monitoring network that is written in HP, MySQL, SNMP, providing you full support for a wide range of network hardware and operating system. It interfaces seamlessly with any SNMP-based device such as Juniper Networks SRX Series, Palo Alto Networks PA Series, and Cisco ASA Series Security Appliances.
LibreNMS provides several modules that can optionally such as network device discovery having ipmon, netflow, status monitoring of network devices like mysqld, memcached, mythes, SNMP Agent to monitor various devices and graphical status via several web interfaces. Other function of this platform includes its web front-end is based on Bootstrap and jQuery, and uses AJAX calls for fetching data from the back-end server and fully supported with IPv6 which is not present in any other traditional software.

Sensu is one of the adorable monitoring applications that monitors servers, services, and application health without any disturbance. It aggregates metrics from a variety of sources and makes them available in a comprehensive dashboard. These metrics can be queried or graphed with interactive features, providing unprecedented insight into your systems.
The main characteristics of this platform include it lets single-machine monitoring, aggregating metrics from multiple sources provides in-depth analytics on metric aggregate data, supported queries with complex SQL-like syntax, including single-valued fields, aggregation over rolling time windows, and the possibility to define thresholds in metrics in any Python callable. Other function of this platform includes you can check metrics from several environments; same nodes can be monitored on multiple interconnected servers and many others.

SigNoz is next-generation monitoring software that aids the developers in monitoring the applications and troubleshoot problems in their developed projects. It integrates with over 1,000 different services and databases to create meaningful monitoring data, which is all stored in an easy-to-query database. The stunning function of this platform includes it gives you real-time alert on the following process like connection timeout, connection failure, display the response & request time in MS, display the total number of requests per second per connection type such as connection success, request success, request failure, runtime exceptions, and many others.
SigNoz is an HTTP server that sits between your application and your logging framework and simplifies the monitoring of your deployed applications by integrating with multiple tools. It analyzes the number of connections with a specific database server and has the ability to store this information in a central location. Linux

Cadvisor is a top-class platform that gives in-depth information related to the usage and performance characteristics of running containers. It makes it easier for users to understand their running docker containers by providing information on CPU, Memory, and Disk I/O usage as well as a range of summary statistics about the container, such as memory percentages used by kernel and user space processes.
It can be further configured to run in the background and collect data in near real-time. To perform any function, you need to log in with your Google account; after registration, it displays the powerful dashboard, enabling you to detect the background application without any disturbance.

Munin is open-source software that allows you to perform system, network, and infrastructure monitoring. It can be quite helpful in keeping a system administrator informed about the status of those critical components of their networks. It provides the foundation for many other open-source tools, such as Nagios or MRTG, which are used for some types of enterprise management.
Munin offers a componentized modularity to provide for flexibility for different environments – whether embedded systems on each host or full monitoring suites across an enterprise’s servers and network devices. It provides a wrapper around RRDTool so that it can write to a MySQL database and a special Munin package for Debian. It displays an overview of cloud monitoring and automation solution for Microsoft Azure. All the results are visualized in the form of attractive graphs or colorful charts, making you collaborate with your teams in seconds.

CloudMonix is next-generation monitoring software that comes with additional monitoring capabilities and self-health automation, enabling you to scan your application in no time. The highlighted function of this platform includes it lets real-time health checks and dashboards for your Azure services, storage, and SQL Azure service metrics, the ability to fix issues such as issues with VM deployment or data backups, automated operations such as reemployment of VMs, replacement of failed databases or email notifications for key events and many others.
You can use APM tools to monitor your web applications, cloud services, and binaries running on servers. The CloudMonix policy engine is designed to run on any Linux-based appliance or virtual machine (VMWare, Xen, KVM). Other function of this platform includes it automatically scale the size of various resources to match the demand such as VMs, SQL Azure, VM Scale-Sets, etc.

Cabot is a free, open-source, self-hosted infrastructure monitoring platform that supports both Linux and Windows environments and monitors all of your host servers in real-time. It provides an interface to view stats like CPU utilization, memory usage, and individual disk usage, hard drive failure rates for both disks and arrays (RAID), network bandwidth available on each port (Ubiquiti USG), the system’s uptime over the last five days or last month, query performance for MySQL/MariaDB/PostgreSQL databases
There are tons of other features that some people prefer to use more than others, like placing support tickets with Amazon Web Services (AWS) or running queries on Amazon Elasticsearch Service (Amazon ES, helping you to monitor your AWS instances or your Amazon ES clusters in real-time. Cabot was created with the intent of being a useful monitoring tool that could be installed on any server, regardless if it had PHP installed or not.

Trafikito is software that is designed for the Linux operating system, making you track CPU, RAM, disk space and send an email when something is going wrong. It provides tools that can be used to monitor for potential problems, including sending alerts when problems arise. It is utilized by the IT professional, system administrator, or network administrator who needs to monitor one or more systems in the enterprise.
There can be multiple instances of the daemon running on different hosts; this allows you to monitor your infrastructure using several different machines, which increases the reliability and availability of your system. It can also be run in “instrumentation” mode, which allows other tools to perform actions on the monitored metrics without affecting the main Trafikito daemon. With the help of its powerful monitoring tool, it monitors applications and detects performance issues by analyzing performance data over time.

Bijk is one of the versatile monitoring software that efficiently monitors your server performance and shares the real-time status with any of your clients. The interesting function of this platform includes it gives you real-time alerts on the different processes such as processes that use too much disk & memory, any exceptions within your application, if the correct packages are installed or not, and many others.
It solves the problem by creating a centralized policy management platform that allows you to manage your policy data once and deploy it to each of your network security devices. Other function of this platform includes its web front-end is based on Bootstrap and jQuery and uses AJAX calls for fetching data from the back-end server and fully supported with IPv6 which is not present in any other traditional software.

RPi-Monitor is an application available for the LINUX operating system which allows the user to get updated data and information about the status of the machine. This application in fact presents all the information and status of PC in a well-managed format. This application helps a lot the user to tell the user about the devices connected including both the input and output devices. Moreover, the network status of the PC is also visible on this application.
This tool allows the user to conveniently add the widget dashboard to the Desktop which always keeps him updated. One of the most appreciated features of this awesome tool is the data encryption it provides to protect the data from malware and virus attacks as well as its leakage. For security purposes, it separates the process of extraction of data from the presentation of data which makes the information more secure and the threat of leakage minimizes.

CULA was a closed source application that allows the user to easily get updates about his upcoming events and the current status of his applications, websites, or any type of other assets or information which might be important for him. This application is now available as Super Monitoring.
IT is now working and serving thousands of users through the Software As a service platform allowing users to conveniently get all the information and updated data at a single platform without switching applications and tabs. It is a paid service that can be bought from the official website, as well as the free version, is also available which allows the user to use the services for a limited time. It provides a bulk of services and features along with a user-friendly easy understood interface that allows the user to find the desired feature conveniently.