
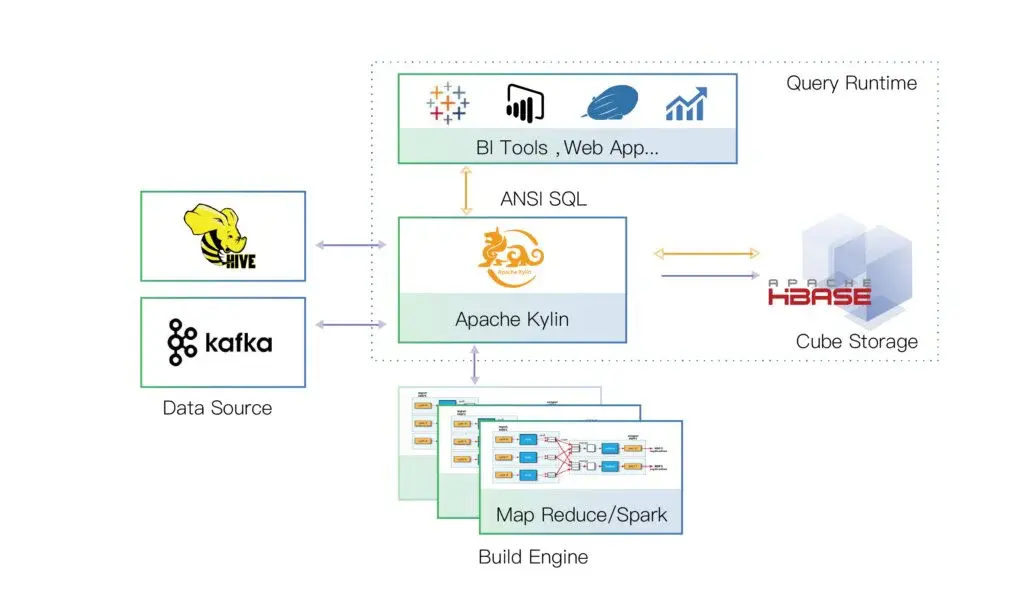
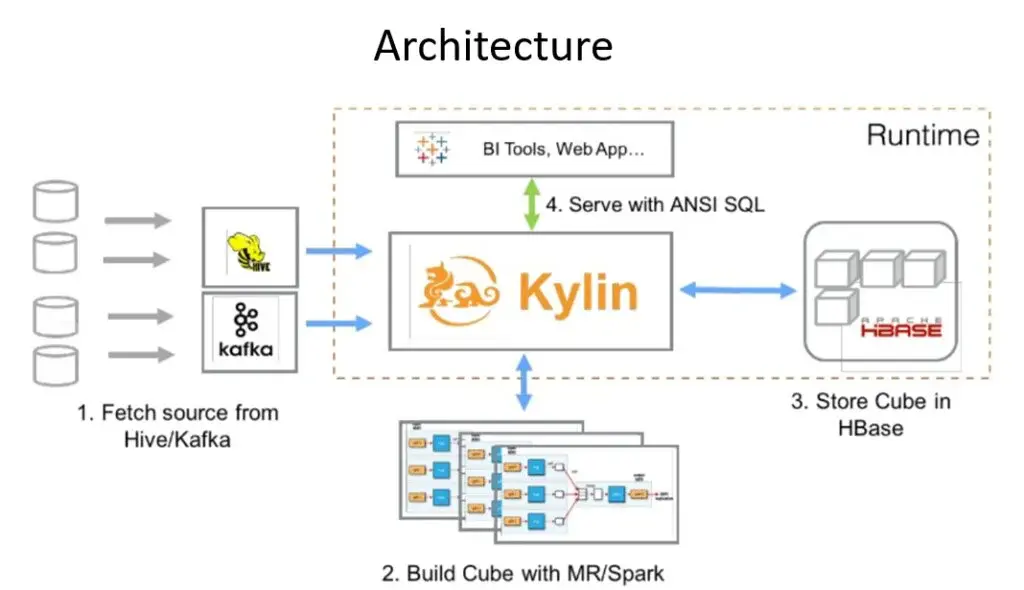
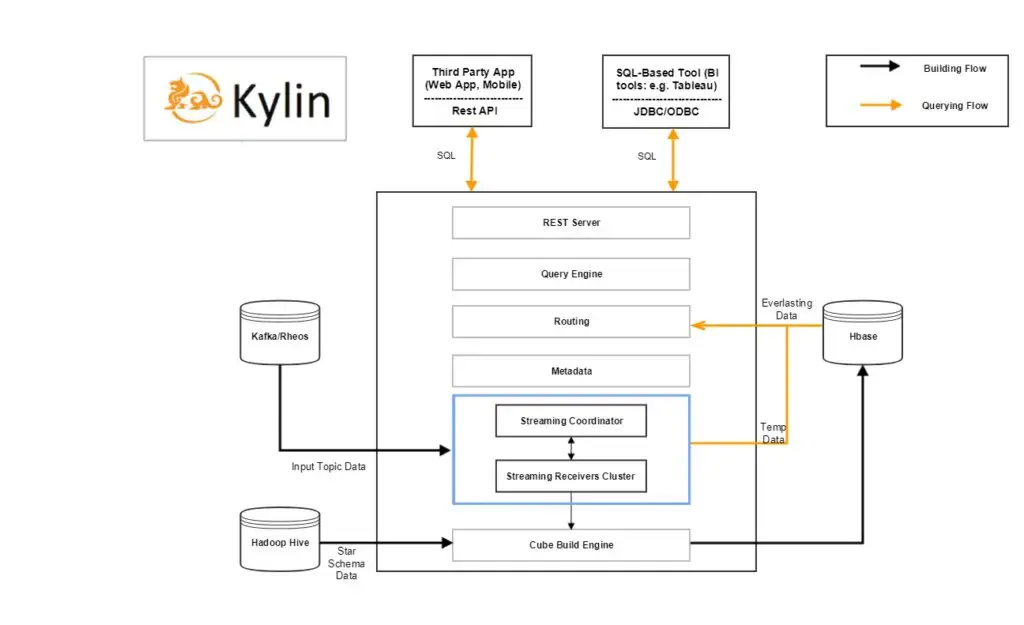
Apache Kylin is a distributed analytical data processing unit that is a fast, distributed, and reliable analytical data warehouse providing you various valuable options, such as metadata, storage engine, and server scaling. It maximizes the power of big data by providing an elastic, highly scalable, and easy-to-use SQL interface to query data stored in a variety of formats, including Apache Hadoop Distributed File System (HDFS), Apache HBase, Apache Phoenix and more.
The system provides the leading open source distributed data warehouse and analytic data platform with the widest variety of use cases. Kylin is uniquely free of such restrictions, delivering on-demand access to any data from any system. Apache Kylin is the first and only open source distributed data warehouse built specifically for personalisation or enterprises with reliable scanning and data integrations.

ObservePoint is an automatic data auditing and monitoring tool that lets users get secure paths by processing complete tracking, enterprise information, cloud solutions, marketing analytics, and other customer insights. It helps e-commerce and other organizations to monitor and audit product data in real-time. It automatically corrects errors and warns of potential problems with product information spread across websites, marketplaces, price comparison engines and more.
ObservePoint is the valuable data auditor platform available to view and make recommendations on your brand’s performance from a competitive analysis standpoint. Its patented technology and visual capabilities allow your brand to understand and optimize its performance due to the integrated and synched database.

Cloudera is a hybrid data cloud and large database management platform that provides powerful commands for enterprise stakeholders or personalize users to exchange information easily through automated integration driven tasks. With its effective processing and automated functionality, it delivers transformational analytics and business intelligence for large data sets across the enterprise.
Customers include leading companies in finance, telecom, manufacturing, eCommerce, technology, education, and government. Cloudera pioneers new approaches that allow enterprises to be increasingly data-driven in their decision making. Cloudera is building an open, scalable data cloud focused on enabling customers to combine in-house, private and third-party data to gain new insights. To ensure the cloud supports a diverse set of customers and use cases, it must build a team that reflects the diversity of the user base.
Hadoop HDFS is a data manager and large file storing platform that provides effective storage technology for enterprise servers and other users with scalable frameworks and high-performance information transfers. The (HDFS) is a distributed file system designed to run on commodity hardware and in multiple locations. It is the backbone of many big data projects and other data processing frameworks.
It is the most extended distributed file system that delivers information quickly without decoding or interpreting details. It is designed as a distributed file system that is designed to be scalable to a very large volume of files and that is architected to be reliable without a single point of failure.

Splunk Enterprise is a powerful database supportive platform that provides a comprehensive solution for businesses and other workflows with several useful features, such as actionable insights, critical operations, machine learning, and cloud-based support. It is a convenient way across your entire IT environment that provides operational intelligence on your systems and business. It is the fastest way to gain real-time business insights from machine data generated by any source, including applications, sensors, devices, browsers and networks for personal or enterprise use.
In the IT world, rapid information delivery is typically achieved through automated coding and testing, continuous integration and deployment tools, and best practices. This unmatched capability combines machine learning, adaptive indexing and real-time analysis to make all data easily accessible. Splunk Enterprise provides a production environment with robust auditing and security controls that can work in concert with existing tools like SIEMs, log management systems and security information and event management (SIEM).
AWS Lake Formation is a robust platform to make an effective data lake by integrating through different servers and clients for exchanging information with complete encryptions and business insights. This new layer of abstraction enables customers to focus on modelling their data from the top-down without any knowledge of how the data lake is provisioned and managed. It simplifies the process of creating an Amazon S3 data lake, enabling customers to easily store any amount of raw data.
The tool simplifies the process of creating an AWS data lake for developers, providing them with blueprints and tools for creating an automated data lake capable of supporting the ingestion and storage of large volumes of data from multiple sources. This new tool is ideal for a wide range of businesses from small merchants to large e-commerce sites as well as digital platforms and enterprises that need to efficiently store and process digital information.

SAP Lumira is a business intelligence software service along with data management solutions that offers various analytics and cloud functions, such as data integrations, and another enterprise database. It is a powerful and automated platform along, such as data management and reporting that empowers analysts and decision-makers to visualize their data and discover new opportunities.
Complex IT operations and technical details can be integrated easily through powerful automated services. SAP Lumira also offers a broad range of visual storytelling, analytics, and reporting capabilities that enable end-users to create and publish interactive business reports that are easy to read, share, and distribute. All the information and data is visualized through impactful insights and infographics with a comprehensive dashboard and control panel.

Azure HDInsight is a cloud distribution and fully-managed, enterprise-grade Apache Hadoop service on Azure that processes massive database and migrate large data in a short span of time. Isolated distribution enables customers to control their own HDInsight clusters while they run in Azure, giving them great flexibility in their choice of hardware and software configurations.
Using the module, you can run big-data analytic workloads on Hadoop clusters that you provision using the Azure portal or the management APIs. Customers can also create clusters and run analytic pipelines using the modules for Apache Spark. Users can run Hadoop as a service, making it easy to deploy, manage and use Hadoop clusters in the cloud. It also makes it easy to manage your Hadoop clusters, enabling you to: clone a cluster, Autoscale a cluster, Scale-out and then scale back up integrations, and many more.
With this new service, you can quickly create a managed cluster without having to worry about the infrastructure. The program helps customers manage their programs by providing role-based access control in a secure environment and by offering an integrated monitoring solution, which can catch any issues early on before they impact your production applications.

Apache Kudu is a data storage engine and analytics program that offers the most efficient and highest-performing column-oriented data processing by integrating different latency and modules like Apache Spark, Apache Flink, Apache Impala, Apache NiFi, and others. It’s a high-performance NoSQL database, built from the ground up to handle big data. It empowers highly interactive, analytical applications that require fast random access and real-time updates.
With integration, real-time streaming capabilities, and support for SQL, the system provides a seamless platform for building modern, cloud-native applications. All of this lets you focus on building great and streamlined functions as a next-generation integration with effective service. It is designed to support fast ad-hoc queries against voluminous datasets. The data can be copied or updated incrementally, and queries are executed efficiently on the updated data with complete encryptions.

Google Cloud Dataflow offers tools that help businesses of all sizes easily build reliable and scalable data processing pipelines with integrated components. Businesses are looking for more powerful and efficient ways to analyze, transform, enrich and extract insights from massive amounts of data. It is a fully managed service for developing and executing data processing pipelines.
It can be used for batch and stream data processing that pipelines are simply directed acyclic graphs (DAGs) of tasks. Nodes in the Dataflow graph represent data sources, sinks, and transformations, including operations such as join, group by, filter, delay, etc. Service makes sure easy to build and scale robust data processing applications, targeting both batch and real-time data.

Apache Phoenix is a next-generation data processing platform that builds upon the strengths of Apache in order to provide industry-leading fully SQL database services. It is an open source relational database built on the rock-solid foundation of Spark SQL. Completely free and open source, Phoenix helps you build lightning-fast applications optimized for real-time transactions. It’s easy to use with minimal code and takes just minutes to set up.
With the module, your customers can rest assured that your application is built on a solid foundation that will scale as you grow. Phoenix comes with everything you need when building a transactional, real-time application: ACID transactions, distributed joins, aggregations, window functions and temporal data handling. It is a general-purpose SQL query engine with features that include: a graph framework, providing an API for processing and querying large volumes of data.

UMLGraph is an automated drawing application currently used by many professionals. It is specially developed to support UML diagrams to make programmers’ and developers’ jobs easy. It allows designers to draw BOM, sequence diagrams declaratively, and UML classes. It also gives a permit to improve the layouts of the diagrams by changing their nodes, miles, and parameter ratio. It allows developers to include private fields in their output if they pass the private flag of the Javadoc.
It will automatically save all the activities and give all commands to the developer. The special areas of this program are sequence diagrams, class diagrams, and UML graphs. It gives the developer a piece of complete information about the diagram, which includes the top view, bottom view, and side views of the diagram. The features which make it one of the best apps are generating high-quality diagrams, supporting various image formats, creating frames for drawings and postscripts.

Neo4j Bloom is a multifunctional graph exploration application for visual interaction with graphs, allowing professionals to visually explore graphical data from a variety of business perspectives. It helps to establish effective communication between colleagues, managers, and supervisors to share innovative work on developing their graphs, and the analytical team allows you to quickly create search and visualization projects without using code. Key features of this software include predictive search, flexible color, icon size and layouts, easy data visualization and exploration, pan, zoom and select functionality, browser, and property editor, and more.
Neo4j Bloom has a natural search interface that allows experts to instantly create categories, tag associations, and graphic templates. You can also improve cross-group collaboration with a no-history search design and minimize complex queries with customizable features based on Cypher and parameter specs. Another awesome feature of this tool is that it identifies influencers, relationships, and neighbors using data-driven styling rules.
Graphviz is an open-source all-in-one graph visualization software that provides you with structural information. The software comes with all the necessary tools and services that make graphing functional with an in-depth analytical overview. There are many different charts available with a deep knowledge of the program in several languages.
The software assists you in many areas of application, including bioinformatics, software development, databases, web design, and visual interfaces for a variety of technical fields. The software is a success for deep data analysis and documentation to help you get to know development programs better. The software instantly tracks errors and provides you with translations in multiple native languages.
Graphviz offers many features including program layouts, SVG for web pages, plain text language, PDFs, interactive graph browsers, and more. This software stands out for its detailed diagrams with many options for color, fonts, table node, line style, hyperlinks, and custom shapes. The software has many resources available to improve the visualization of programming.

Gephi is the analysis software for graphs and networks. This software supports a 3D render engine, which helps its users to provide real-time networks. The other important fact of this 3D render engine is its enhancing exploration. The users of this software do not require any programming skills. This software allows users to explore new possibilities with the help of dynamic architecture designs. Many features are also available in this software, which helps users understand the networks.
A wide range of data is available for the users to do various functions as spatializing, filtering, clustering, navigating, etc. This software allows the users to customize theirs work efficiently with the help of layouts, matrices, data sources, and tools. The software is compatible with Windows, macOS X, and Linux users. This software can also print maps, which helps the users to promote their poster creation work. It can also be used for biological and social network analysis.

Tom Sawyer Software is used to create graph visualization and analysis of the data in real-time with minimum coding efforts. It offers various filters and customization options that allow the users to skip the modeling phase and complete the design in less time. It helps them to alter their schema with its editor and create designs that are unique, with multiple layouts and views.
It creates images that are scene-based nodes that are easier to understand and improve the structure of the graph with the help of nested drawings. It intelligently provides the labeling and routing, which is a clear edge to clear all the quires of the users. They can visualize their work with more details with the help of provided connectors that explains all the points. It also efficiently connects the graphs with the data and allows users to visualize and analyze them, and also helps to optimize the business operations by developing a detailed business model.

Hume is a type of graph ecosystem with advanced processing language for data science. It saves all details related to data transformation, information retrieval, provision, and breakdown. It licenses data scientists and analysts with the power of queries, algorithms, and graphing data; it is the most scalable, reliable, and fastest way to get perceptions from the data by exploring a code-free graph ecosystem. It helps the user to improve analytics machine learning skills to make sense of amorphous data sources.
It extracts meanings from unstructured data sources to enhance users’ predictive capabilities. It connected the gathered data to make it interactive, understandable, and collaborative without any coding skills to make this app easy to use. It allows users to convert numerous distributed data sources into a distinct connected source to make the interface clean. The key features of this program include Graph Database, Fraud Detection, Data Analytics, AI-powered, Big Data Analysis, Embedded Graphs, Business Intelligence, and much more.

KeyLines is a Javascript-based development kit used to build apps that permits the user to follow data analytics. It supports many languages and vital tools to make the program work professionally and avoid complications during work. It allows users to build data-driven applications to visualize data. The main vision of this tool is to build the best visualization software that reveals threats and insights in connected data to make the world safer. It offers some unique services such as auto layouts, customization, and geospatial networks.
It is a reliable tool with an experienced team and is trusted by many customers worldwide. It will give a quick and helpful response to customers if they have any issues. This program stands out for its robust API integration and detailed documentation, which ensures that the user doesn’t face any problems. It offers many features, including automatic layouts to suit any network, node aggregation, network filtering, time-based analysis, social media analysis, and many more.

Linkurious is the software that is used to develop visualization graphs and protects the system after the complete analyses. It intelligently optimizes the system process and combines the data visualization with robust research, and protects the system by exposing the hidden criminals, fraudsters, and money launderers. It helps to convert the complex data into the visualization form, which is easy to understand and allows the users to focus on the critical information. It detects the specious cases and their connections from the complex data, indicates them to the users, and saves a lot of investigation time.
It empowers the users by providing the ability to detect criminals with 20% more efficiency, reduces their investigation time by 10%, and saves their time on alerts by 30%. This software works on advanced machine learning and graph analytics to provide sophisticated solutions. Most of the alerts that appear on the system are false positives. It uses its case management system to find the link among the existing alerts and analyze those events that occur multiple times.

Sentinel Visualizer is a next-generation visualizer to analyze big data; it authorizes the demanding needs of investigators, researchers, intelligence analysts, and law enforcement. It provides insight into the trends & patterns hidden in your data with its best-of-breed usability and edge cutting features. To generate optimized views to highlight the important entities, it has radical drawing and redrawing features. It reveals the most exciting suspects in intricate webs with squelching, shortest path analysis, advanced filtering, timelines, and integrated geospatial features.
It helps you to see many links rapidly among different model types and articles. This tool supports relationship records and entities with the help of Microsoft SQL Server. It can instantly identify centrality, key points, and node importance by using Social Network Analysis (SNA). Sentinel Visualizer is the only application that gives a configurable, powerful, and scalable database in Microsoft SQL Server; that’s why it can easily store any information.

KeyLines Graph Visualization Toolkit is a JavaScript toolkit program. It is mostly used by developers to develop powerful network visualization apps rapidly. This tool can operate in a web browser, server, database, or device and make them easy to participate in dashboards, existing systems with clear tutorials, API documentation, and Demos. It is highly attractive with analytical functions including, Dynamic graph support, Social network analysis measures, Geospatial graph visualization, Automatic graph layouts, Graph filtering, WebGL, and HTML5 canvas graphics rendering.
Users can uncover network issues quickly by collaborating with the developer. It has a powerful visualization program and key lines, which increases user performance. It gives you a perceptive visualization experience by using HTML and attentively crafted code. This app is run by new technologies; it can easily move in tools and can be improved by anyone. Users can change visualization products in a flexible way by its build game feature.

Agens Browser is the web-based interface for data visualization and managing huge graph data. It provides advanced-level tools for visualization of the data and graph templates which are easily modified by the Cypher and QL. It also helps the users by offering graph modeling management related to data storage, and they also generate the reports after conducting the analysis. It also offers flexible graph layouts, EDA tools, OLAP, and meta-graphs, and the users can easily find the solutions and modify their graph data on its comprehensive interface while remaining on the premises of the web.
It is fully supported by the API. It is compatible with the servers like MS Windows 8, macOS, Linux, UNIX, and the browsers such as Chrome. Firefox, Edge, Safari, etc. The interface screen has two areas, one is the menu area, and the other one is the main area. The Menu area contains the functions which are organized by the purpose, and the main area has views and results of the various executions.

ReGraph by Cambridge Intelligence is the toolkit that helps the react developers to add strong visualization graphs in their applications. It provides the API which allows adding the graphs quickly in the applications. These robust visualization graph tools help them to detect threats and understand the data. It helps users by providing easy coding situations, known logic, easy handling, and props that are fully documented. It also allows them to select the location for data storage and the characteristics of all the components.
It is compatible and easily integrated with any browser, other devices, server, database, etc. It supports the users by providing tutorials, videos, codes, and platforms to practice codes. They can perform various analyses in this toolkit, such as time-based, Geospatial, and social network analysis, and also combine the various nodes and links of their data and use automatic graphs layout, etc. The graphs provided by this toolkit are easily scalable to any modern technology.
PlantUML is an open-source tool for creating UML diagrams from plain text descriptions. Using this, designers can quickly draw a variety of diagrams, including sequence diagram, class diagram, use case diagram, action diagram, component diagram, wireframe GUI, object diagram, state diagram, deployment diagram, and many more. Most of the functions and ways of working are of the Graphviz type, which means rendering different kinds of charts and diagrams such as syntax, Ditaa, Dot, and others. If you’re talking about images, then they can be generated in PNG, LaTeX, and even SVG formats.
Best of all, PlantUML can even be used to create ASCII art diagrams that are only for sequence diagrams. PlantUML uses basic human-readable text descriptions to draw UML diagrams more easily and quickly. However, designers should remember that PlantUML does not prevent designers from even drawing an incompatible diagram in which two classes inherit from each other. So in this case, designers have to be careful. Another issue with PlantUML is that it is sometimes reluctant to customize with most operating systems.

ClueMaker is a program used for data analytics. It is an economical and manageable visualizer of flows, links, and relations between different subjects. It helps in journalism, crime, online bank security, insurance & loan frauds, and corruption investigation by connecting the sources and visualizing & analyzing them from related useful data. Data sources supported by this tool include Word excel, Aster data, Microsoft SQL Server, Tera data, Netezza, Oracle database, and many more.
All the information that you have about the project, e.g., names of suspects, phone numbers, locations, etc., are imported that information in ClueMaker and run a search against the database; it will show you all the matched entities and can easily start the investigation process. It identifies entities from the database quickly, keeps the dataset up to date, allows you to work in excel and continue it in your database. Each action is logged with editor name and time and can be protected by a password to prevent unauthorized edits.

UMLet is an intelligent software to draw UML diagrams. This open-source software offers a simple and user-friendly interface. You can draw diagrams utilizing its tool and export them in various forms such as eps, pdf, jpg, SVG, etc. The users can quickly build multiple sequences and activity diagrams just from plain text. It is a stand-alone tool, but the users can also access it from Windows, OS X, Linux, etc.
The tools provided by this software allow you to create your diagrams fast. Various templates are available, enabling users to modify the elements quickly. This software supports multiple forms of UML diagrams such as case, state, activity, deployment, and sequence diagrams. You can also customize their UML elements with this tool. By changing a few lines of JavaScript in the run time, you can easily modify the look of the UML element. You can use the free version of this software for seven days.