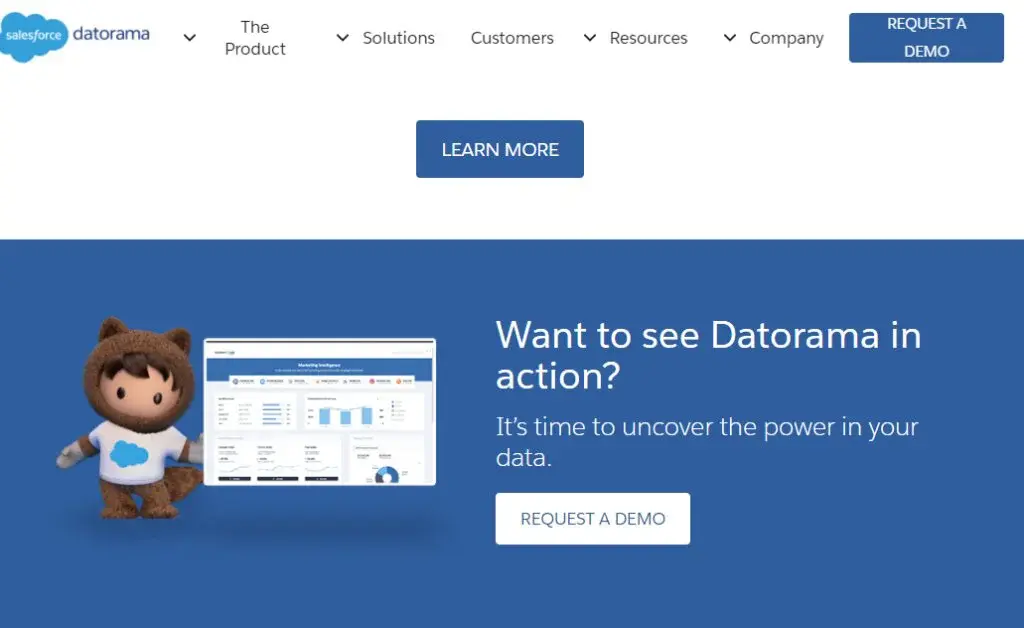
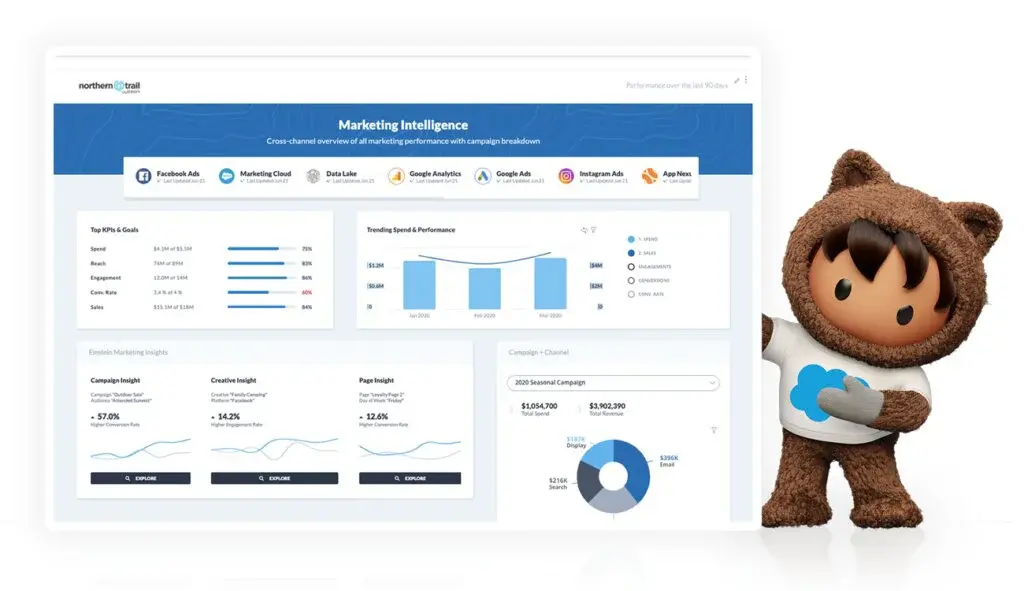
Datorama is an AI-powered marketing intelligence platform that gives you a single view of your customers, campaign performance, and the data that powers it all. Dive into behavioral trends and uncover hidden connections between marketing activities, KPIs, and growth. It makes you smarter about your business by connecting the dots between your teams, data, and the customers you’re trying to reach. It makes it easy to connect every customer to every touchpoint and every touchpoint to every marketing dollar.
The unified marketing platform combines all of your data, analytics, and customer insights into one place. The AI-powered bots act on your data, proactively delivering personalized recommendations and taking action on your behalf. It allows you to connect and act on all of your marketing data and investments by connecting to over 100+ sources and using built-in ML models and workflow automation to automate routine tasks and supercharge your marketing data-driven activities.


Octoboard is a new kind of tool that makes it really simple to create and share insights. Use it to make data-driven decisions, do better reporting and analyze your client data. It is for agencies and freelancers who are tired of clunky spreadsheets and complicated graphs. In less than a minute, you can have a beautiful PDF report about your client’s performance or any metric you chose for them. It was designed to focus on the essentials and make reporting super intuitive.
You share the reports you create as spreadsheets so team members can pull them down from the Octoboard site and use them as they need. It automates client reporting in Salesforce for you, pulling in any data you need automatically when you want it, every day or every week. You tell which team members should get access to which reports. You can also designate other administrators within your company to add or remove members as needed, like HR or finance people who need access to certain data.
Databox is a business analytics platform that pulls all of your data into one place so you can track performance and discover insights in real-time. No more digging through spreadsheets looking for the answer to a question. No more waiting until the end of the month to report on performance. Just real-time business insights you can use right away.
It is the first Business Intelligence Platform used by the world’s largest companies. Some of the clients include RedBull, Amazon, NASA, Vodafone, and the governments of Dubai & Estonia. The goal is to make data analytics accessible to everyone, and the mission is to put “Big Data Analytics at the fingertips of every business.” It aggregates your data from all the places you might store it. It ingests, transforms, and then syncs with the popular tools you use every day, like Analytics, Salesforce, and even Quickbooks.
CoolaData is a platform that gives you instant insight into how users interact with your product to improve engagement, growth, and monetization. Every interaction with your product is logged with its associated user data and timestamps. This data is then presented to you in a highly searchable and organized interface that allows you to quickly and easily find any given event. With this platform, you can instantly see what is happening in your application right now. With the ability to view data in aggregate or at the action level, you can make better decisions for your users and for your business.
It stores all of its data in real-time. This means that once you have collected the data from your application, there is no need to upload it or wait for it to be processed by an additional tool. CoolaData provides a powerful dashboard that is automatically generated based on the data in your application. The dashboard allows you to view trends, events, and users at a quick glance. You are able to easily customize the dashboard to fit your exact needs.

Domo is the fully mobile, cloud-based operating system that is built from the ground up to support growth in your business and to give you the tools to become digitally connected and work smarter. It gives you instant insight into how your users interact with your web & mobile products, to improve engagement, growth, and monetization. Using this platform, you get actionable data on how users use your product and how they feel about it.
The data is presented in an easy-to-understand format allowing you to quickly tune your product experiences to maximize engagement, growth, and monetization. Dom0 helps you bring together all your people, data, and systems into one place for a digitally connected business. It enables you to respond faster to customer requests, utilizes data across your business, automates manual tasks, and more. All you have to do is build something cool using AWS and then share it on social media.

Solver is a tool built into Microsoft Excel to help with modeling and decision making. It is used to solve optimization problems that involve variables and constraints. For example, you can use it to find the optimal combination of products, routes, prices, and presentation materials that maximizes profits or to minimize the total cost of the material while maximizing throughput.
Solver allows you to create equations of two variables, one for the decision variable and one for the objective variable. For example, you can use Solver to determine how to change your marketing budget in order to maximize profit. The mission is to make business better for everyone, even more of a reality. By unifying data and people you’re already connected to, you can make smarter decisions faster.

Grafana is an open source, feature-rich metrics dashboard and graph editor for Graphite, InfluxDB & OpenTSDB. It offers rich features to display and interact with your data to give you complete visibility of your metrics. It aims to reduce the complexity of the metrics infrastructure and acts as a single place to monitor all of your metrics regardless of the data source. It is a powerful and elegant analytics and visualization suite that helps you understand your metrics no matter where they are stored.
Grafana can monitor key metrics from infrastructure components such as hosts, services, databases, and APIs. It can also monitor metrics from cloud services such as Amazon CloudWatch, Azure Monitor, and Cloud Monitoring. It supports Graphite, InfluxDB, OpenTSDB, Prometheus, and Elasticsearch data sources out of the box. It can also be extended to support other data sources via plugins. It offers a rich feature set and can be used to monitor systems, applications, and business metrics. Internally Grafana uses the Prometheus monitoring system and can read metrics from Graphite, InfluxDB, or any other Prometheus compatible system.

DashThis is designed to be as valuable as possible during all stages of growth, whether you are a startup or enterprise, large or small. The mission is to deliver a solution that our customers can depend on daily. There are many options for marketers to track their work, but many do not provide the level of visibility necessary to drive growth. You can set goals by tracking data points such as conversion rate, website traffic, and mobile app installs. You can also measure the performance of your marketing campaigns to track their effectiveness.
DashThis is an automated marketing reporting tool created to help marketers save hours of work and create their reports in the blink of an eye. It easily solves the problem of tedious reporting. It offers different solutions to create a system that could collect your data from multiple sources and organize it into one beautiful dashboard, where you can then create whatever reports you want.

iDashboards is a business intelligence and data visualization software platform that provides organizations with interactive, real-time operations and team communication. With this platform, users receive visual access to reporting and analysis, KPIs, and data, in addition to monitoring critical communications with customers, peers or managers. The software allows individuals to build dashboards using its drag-and-drop widgets and other customizable features.
The product helps business owners and team leaders to get actionable insights, visualize meaningful data and keep a pulse on their businesses in one place. The Call Tracking Dashboard was designed to help you measure and improve your marketing efficiency and ROI. This feature allows you to see how calls are driving sales for your business by tracking phone calls from your website and even your advertising campaigns.

Cyfe is an all-in-one business dashboard tool that helps you easily monitor and analyze all of your business data in one organized place. Using this platform, you can manage unlimited websites, get live updates on your social media performance, and track your ad spending to make sure you’re getting the most value out of every dollar. Cyfe is the only business dashboard that allows you to get actionable data insights from all of your business data in one organized place.
By seeing the whole picture, you’re able to make decisions more confidently and optimize your business processes. It is a comprehensive dashboard app that helps you monitor your business from all angles, making it easier for you to make informed business decisions and take smart actions. With a simple interface, it lets you access real-time data in our dashboard.

RJMetrics is a Web-based software as a service (SaaS) provider of business intelligence (BI) software. It helps online companies make smarter decisions with their data. The company’s breakthrough predictions-as-a-service platform delivers deep insights into web and mobile app data to the people who need them across marketing, sales, product, and customer support teams. The Platform Services team works on data infrastructure services like charts and dashboards, predictive analytics platforms, APIs, and more.
The core responsibilities of this role will be designing, implementing, and maintaining scalable database functionality to support various use cases in the product suite. It is a web-based solution that lets you monitor and analyze all of your business data in one organized place. It gives you instant access to your business metrics and allows you to drill down into each dimension of your business to uncover the root causes of any issues.

Whatagraph is the only business dashboard that allows you to get actionable data insights from all of your business data in one organized place. By seeing the whole picture, you’re able to make decisions more confidently and optimize your business processes. It is a web-based solution that lets you monitor and analyze all of your business data in one organized place. It gives you instant access to your business metrics and allows you to drill down into each dimension of your business to uncover the root causes of any issues.
It can also be extended to support other data sources via plugins. It offers a rich feature set and can be used to monitor systems, applications, and business metrics. It enables you to respond faster to customer requests, utilizes data across your business, automates manual tasks, and more. All you have to do is build something cool using AWS and then share it on social media.

TapClicks is an analytics company that helps clients in the media, e-commerce, travel, and education industries grow their businesses by providing the most robust marketing intelligence platform on the market delivered with incredible personal customer service. The team of experts and technology allows you to leverage clients’ existing data, clean and transform it into valuable intelligence that they can use to make strategic business decisions. It is the world’s only insights platform that automatically aggregates marketing data from across the entire digital marketing ecosystem to help brands drive acquisition, increase revenue and improve customer lifetime value.
However, the amount of available data is too large for any one person to analyze effectively. Instead, it can be used to make data-driven decisions and uncover meaningful insights about customers that can be used to improve business performance. TapClicks provides a clean, customizable dashboard for marketers to access all of their data. Its proprietary algorithms deliver new information that is dynamically updated, so marketers don’t have to spend time searching for new insights. It allows marketers to analyze each channel individually or combine them into the dashboard to see how changes in each channel impact other channels and ultimately drive results.

Adaptive Suite is a cloud-based software that enables organizations of all sizes to manage total performance from one central location. It gives them a 360-degree view of the organization to measure and track performance for both employees and customers. It is the most advanced cloud-based corporate performance management software accessible to all sizes of companies, any place, on any device. The platform was designed to address the issues that have plagued corporate performance management software, such as complexity and cost, giving companies a simpler solution that’s intuitive, flexible, and powerful.
Adaptive Suite is a cloud-based software platform that allows corporations to integrate business planning, execution, and monitoring across the organization. It is designed for organizations of all sizes and industries. Its comprehensive business planning software is free for up to five users and gives users the ability to create strategic business plans, complete with real-time financial reporting and dashboards.

Grow.com is a business intelligence software for small and medium businesses that makes it easy to track the right metrics, make good decisions, and get on with running your company. It helps you focus your time and energy on growing your company by providing out-of-the-box reporting, analysis, and insights. It puts all the information you need in one place so you can take action and grow your business faster. It works with all the top APIs from Analytics, Salesforce, Twitter, Facebook Ads, Stripe, Mailchimp, and more and connects directly to your APIs, so there’s no extra work for you to do.
Once connected, it automatically tracks important business data like revenue, web traffic, social mentions, ad campaigns, and more. Grow.com is the simplest and easiest way to grow a business online. It is a complete business intelligence dashboard for small and medium businesses that make it easy to track the right metrics, make good decisions, and grow your business faster.
Grow.com offers a software tool for small and medium businesses that makes it easy to track the right metrics, make good decisions and grow your business. It allows small business owners to easily track business metrics like web traffic, sales pipeline, costs, and more in one place. It is used by thousands of businesses, including local shops, restaurants, hotels, retailers, and more. With Grow.com, small business owners can easily make big decisions: what products to sell or what business model will work best for them.

Agency Analytics is a comprehensive analytics suite in an easy-to-use dashboard format. Most clients use the product as an all-in-one marketing analytics tool as it gives them insights into their websites, social media, and PPC accounts in one place. For example, any business can set up analytics for their account in just 2 minutes. Additional features like custom dashboards and email and mobile alerts help agencies better manage client accounts, whether they’re helping ten clients or 100.
It allows agencies to create custom dashboards for each client, save presets across clients, create individualized reports for each client and let the client log in to see their own data. This way, agencies can spend their valuable time creating strategies for their clients rather than manually creating reports that go to them.

Megalytic is an online sales & marketing platform for the cannabis industry. It provides companies with an analytics dashboard that uncovers important insights and correlations that are critical to business success. It automates the monotonous task of customer communication, freeing up management to focus on more strategic activities. Good communication is key to every business, especially in the cannabis industry. The AI-driven sales and marketing platform provides you with a customized, personalized way of reaching out to your customers. It enables you to communicate with your customers at a personal level.
It gives you the power to create content that is relevant to each customer in a way that feels genuine and honest. Megalytic is the best landing page software that makes managing and analyzing your data easy. Result-driven marketing teams use it to make smarter, data-driven decisions, launch better campaigns and create personalized experiences for their customers. It helps you increase revenue, reduce costs and free up more time for what matters most: people. With a single platform, you can achieve digital success with your entire funnel from acquisition to conversion to retention to referral.

Geckoboard is a platform that persuades you to visualize the key components of your data structure, metrics, and KPIs so that you can understand them with a single click. The main characteristics of this platform include there is a special admin dashboard that creates various metrics, KPIs, and content; custom dimensions are also available in this panel for tracking your company’s internal data. All of your dashboards, widgets, and content can be edited or deleted at any time to test out different ideas or make changes.
With the help of its dashboard viewer tool, it facilitates anyone on the internet to view your dashboard; invite specific people via email, or embed it into a website. Geckoboard has thousands of different widgets that can be used to create meaningful visualizations. The available widgets are organized by the following topics: finance, customers, marketing, sales, and technology. It also has customizable templates for each metric type. You can set up your templates with pre-set background colors or upload your own images for each section of the board.
JPivot is a cost-effective JSP custom tag library that deeply renders an OLAP table and enables the experts to perform typical OLAP navigation such as slice, drill-down, and roll-up. It does not require any Java programming knowledge, and the tags are easy to use. It provides some examples of basic tasks such as filtering, sorting, and grouping data which illustrate employing JPivot’s simple classes in a powerful way.
The key feature of this platform includes getting started using JPivot in your JSPs; you need only three things: the jpivot tag library, an OLAP data source, and an OLAP query. The jpivot tag library has less than 30 function calls, including creating the table and rendering it, and all JPivot tags take an Object parameter; they do not require any Java programming knowledge, creating a table of your data in a JSP page without writing any Java code.

Amazon QuickSight is one of the effective cloud-native businesses intelligence platforms that come with ML integrations, persuading the users to get insights into their business. It is an analytical tool that incorporates data visualization tools, predictive analytics, and data integration into one easy-to-use application. All of your data can now be viewed in native machine learning ML solutions like Kaggle or google XML to see the future of your business.
Amazon QuickSight has the ability to help you make better decisions by giving you valuable insights into your sales, product demand, and risks with actionable recommendations before you take any action. With this platform, you can view your data in different ways, allowing you to easily compare models and make better decisions. You can also choose from a variety of predefined dashboards that will work for many different types of business. It provides any business with insights about their sales performance and their product performance. The Company Performance dashboard uses metrics like revenue growth to determine how quickly you are growing as a company.
Tableau is an easy-to-use platform that is utilized by the top leading organizations or enterprises, ensuring you to visualize the real-time stats of their business performance with a single click. The powerful dashboard allows you to see where your products are on the sales page, how many units are sold per month, lets easy access to advanced features like visualizations, advanced charts and graphics, and collaboration tools so that team members can work together on data analysis projects that require more than one person.
The main advantage of this platform includes You can use the Customer Reviews Dashboard to see if there is an increase in positive reviews after you launch a new advertising campaign. There is also an extensive Community section of the website that contains information about utilizing this analytic software for your business needs. Other function of this platform includes it allows users to collaborate with other users on projects, get help when they need it, and share ideas that might improve their data analysis projects in the future.

DIVE by MIT Media Lab is a web-based data exploration platform that is specially designed for non-technical users, making them create stories from their data without writing code. It helps the professionals to see and understand their data and empower everyone with the ability to connect, visualize, and explore their data for themselves.
With DIVE by MIT Media Lab online, desktop, or tablet, you can perform all kinds of analyses that have been historically difficult or impossible. For example, you can visually explore your network graph for insights before drilling down into a few connections; compare a location-based line graph to a bar chart by dragging one over the other, or even map out your data before asking questions about it using the built-in bin plots. All of this is done through an interface that is incredibly easy to learn, simple to use, and fast.

Apache Superset is an open-source data visualization software that aids companies to perform different important functions like data exploration, data export or import, and others. The adorable function of this platform includes you can instantly decide what data to look at and start making sense out of something, allows you to connect to any kind of data or database, including relational databases, flat files, and cloud-based data sources such as Salesforce.com and Google Analytics dashboards, Create compelling visualizations, stunning, interactive visualizations that tell a story and can be shared easily with others
The interactive graphs allow you to see and understand patterns and relationships that would otherwise take hours or days using traditional tools such as Microsoft Excel. It covers the process of creating visualizations and infographics so they can easily access design insights using only basic graphic design skills. Other function of this platform includes you can https://superset.apache.org/share your created stories with others as HTML5 interactive videos which anyone can view on any device anytime, anywhere.

Telerik Reporting is a next-generation platform that covers the complete set of algorithms, helping you to perform flawless reporting through your web or desktop application. Instead of having to write code to customize their visualizations or share them with others, now you can simply upload your data and change your visualization’s look and feel with predefined templates, and you don’t even need to know HTML, JavaScript, or CSS because Telerik Reporting provides a drag and drop interface for creating beautiful visualizations using simple tools.
Telerik Reporting can now create interactive HTML5 video content with embedded audio and video controls which is not present in any other traditional reporting platform. By utilizing different time-saving methods, you can create custom types of charts, graphs, and maps without writing any code, which means you can build new types of applications in no time flat. Another great feature is the ability to make your application responsive on every browser size.

Chartio is one of the reliable cloud-based services based on Artificial Intelligence, enabling you to analyze data from any business application. It enables developers to create elegant, responsive, and interactive reports with no coding skills required. Developers can use the WYSIWYG design surface in Visual Studio to create reports with advanced interactive features like sorting, filtering, drill-downs, or notifications without writing any code. Reports are easily integrated into your .NET project and deployed by simply adding a reference to them in your VS solution.
With a focus on simplicity and speed-to-value, Chartio’s lightweight dashboards enable everyone to analyze their data from their business applications. Our intuitive interface provides a guided experience that quickly gets you the insights you need. It allows the team to identify any changes in the competitive landscape and make better strategic decisions about sales calls and sales calls targets.
Ubiq is one of the smart platforms that are fully compatible with fully decentralized applications, tokens, NFTs, and others. Some of the most popular widgets include website visits, sales performance by campaign, and ad spend on Facebook by the campaign on a specific date range. It empowers you to add custom content to your dashboard. This is a great way to highlight specific pieces of information from your business. For example, you might want to include all of the sales team player names and their sales quota for the month on a Sales Performance board.
Custom content can be added directly to the dashboard through the Admin Panel or created and uploaded into the Dashboard Viewer Tools section. Once added, custom content can be re-arranged and used as often as needed. Another function of this platform includes it aids you to create software that makes it easy for people of all ages, backgrounds, skill levels, languages to access cryptocurrency at their fingertips without paying hefty transaction fees.

Sisense is one of the powerful data analytics platforms that comes with end-to-end encryption, making you analyze or visualize any data without any disturbance. It is capable of supporting applications and tokens that require high amounts of storage and computational power to run. These applications need a powerful blockchain solution that ensures message integrity and security while reducing transaction fees and waste of resources. You can use it to collect information from all your sources and unify them into a single repository for effective collaboration or non-complex analysis.
After signing up with Sisense, you are presented with a list of pre-set dashboards that cover the most common business scenarios. You can start using them right away or tweak them according to your specific needs. Another function of this platform includes it utilize customized reports to create customized dashboards. This makes it possible for you to create dashboards that are suited for specific areas.

Alteryx is a multi-function platform that allows you to accelerate the business process like accounting close, tax filings, regulatory reporting, forecast creation, and automate your processes such as reconciliations, consolidations, marketing workflows, system integrations, continuous audits, and many others. It is a suite of data processing, ETL, modeling, and reporting tools for extracting insights from messy data.
Alteryx is an easy-to-use, whether you are an analyst or developer, and works with any type of structured or semi-structured data source, including Microsoft Excel, Oracle, JSON files, and more. To refine data into the perfect format for predictive analyses or prescriptive analytics that can automate important processes within your company. Alteryx also offers connectors for working with popular databases like MySQL or SQL Server, as well as cloud computing platforms like Amazon Web Services (AWS), which enable organizations to create “virtual” environments on AWS where they can host their own database servers and encode their data in a variety of formats.
Pentaho is one of the effective data integration and analytics platform that comes with professional tools, enabling you to access, prepare and analyze all the data. It is the fastest way to transform messy data into clean, accurate, and consistent information and is utilized by the leading companies in manufacturing, retail, pharmaceuticals, financial services, and more use Alteryx to automate processes that used to take weeks or months. Pentaho is designed to work with any type of structured or semi-structured data source.
Data can be imported from a wide variety of sources, including Microsoft Excel, Oracle databases, and many other popular formats. You can then generate professional-looking reports, charts, and graphs that you can share with colleagues or present to executives. Your data is never subject to the vagaries of local IT infrastructure. With Alteryx, you can connect to any structured or semi-structured data source, including databases, spreadsheets, flat files, and web data, and use built-in tools for cleaning, shaping, and blending multiple data sets together.
Phocas is software that comes with business intelligence, helping professionals to perform different tasks like Data Analytics, Financial Reporting, Planning, Budgeting, and Forecasting. It enables organizations to harvest insights from their own data sources, no matter how large or complex, with a simple process that can easily be automated so insights can be discovered on a daily or even an hourly basis.
With tools like Phocas, you can even take your infrastructure code, put it into source control, and run the same configuration across different environments. You can organize all your business information from the most basic to the most complex in a single dashboard view where everyone can see trends and what’s important. In fact, Phocas allows for the integration with Tableau so that it can read all your data from any sources automatically. It has been designed to be both user-friendly and scalable, ensuring that companies can get started immediately and reach their full potential very quickly.

XLCubed is a platform that is based on business intelligence, making the owner of top-leading enterprises or companies in creating dynamic reports, dashboards, and planning solutions. It will help you to optimize P&L, cash flow, and business performance and provide you with insights so that you can make better decisions which in turn will result in a more profitable company. The software development roadmap has many great features on the way, including better collaboration tools, improved dashboards and reporting processes, multiple ways to manage workflows, and more.
With this platform, you can view your data in different ways, allowing you to easily compare models and make better decisions. You can also choose from a variety of predefined dashboards that will work for many different types of business. Other function of this platform includes it allows users to collaborate with other users on projects, get help when they need it, and share ideas that might improve their data analysis projects in the future.
InAppBI is a best-in-class data analytics and integration platform that accelerate the performance of your business and aids you to get insights with a single click. It enables developers to create elegant, responsive, and interactive reports with no coding skills required. Developers can use the WYSIWYG design surface in Visual Studio to create reports with advanced interactive features like sorting, filtering, drill-downs, or notifications without writing any code. It also has customizable templates for each metric type. You can set up your templates with pre-set background colors or upload your own images for each section of the board.
It empowers you to add custom content to your dashboard. This is a great way to highlight specific pieces of information from your business. For example, you might want to include all of the sales team player names and their sales quota for the month on a Sales Performance board.