
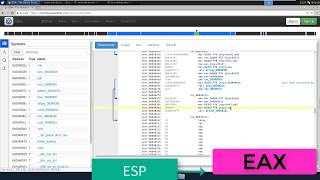
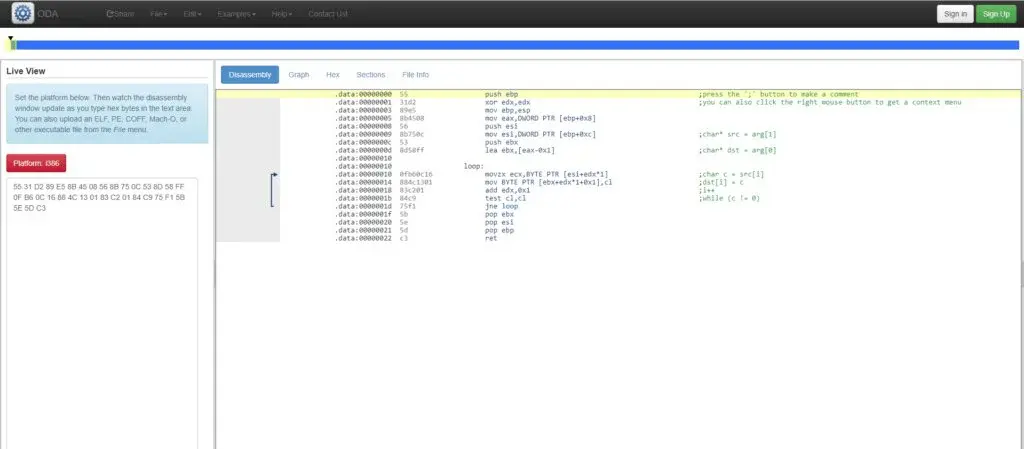
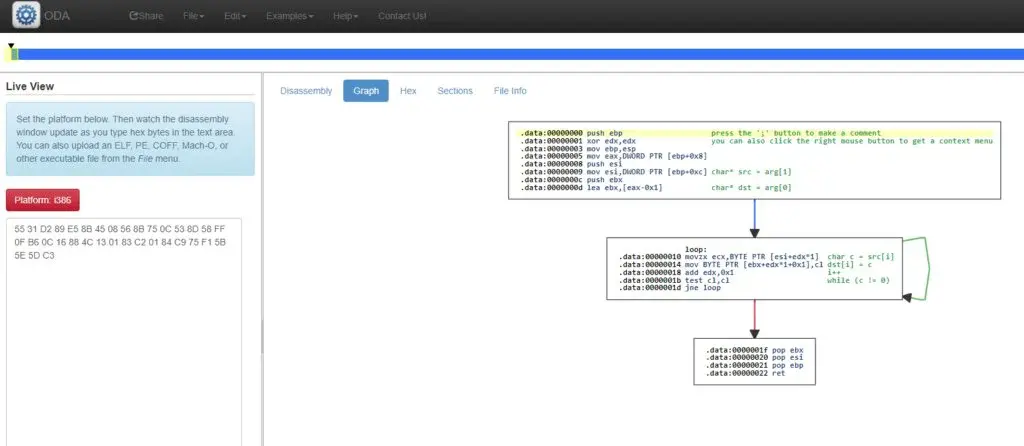
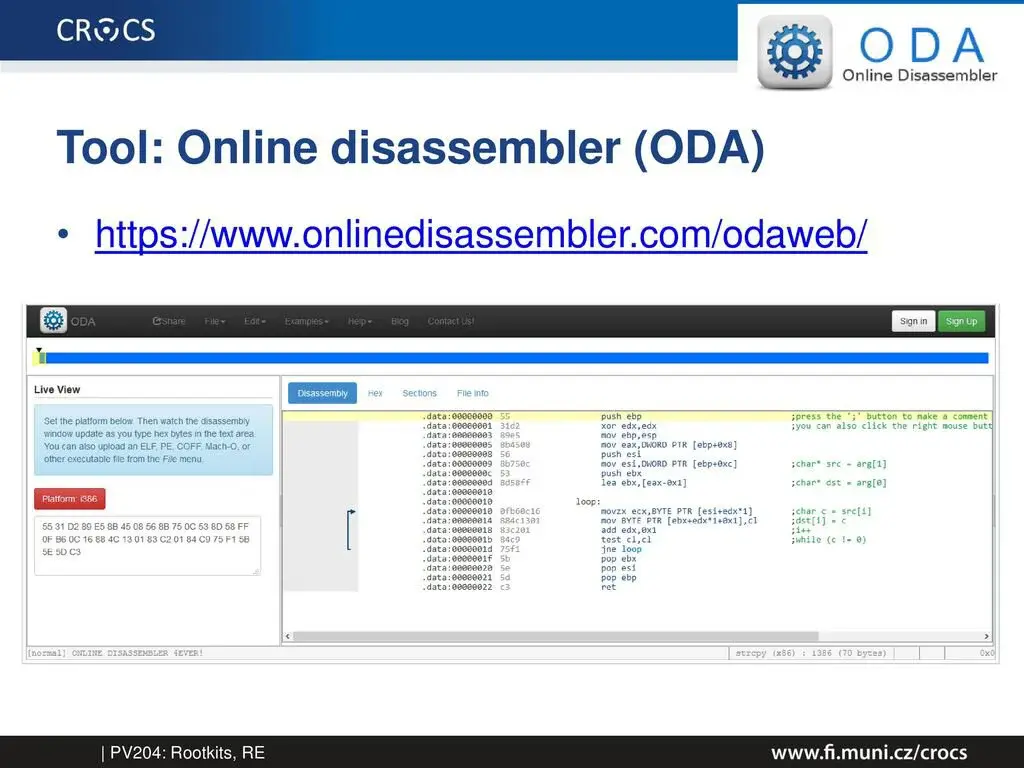
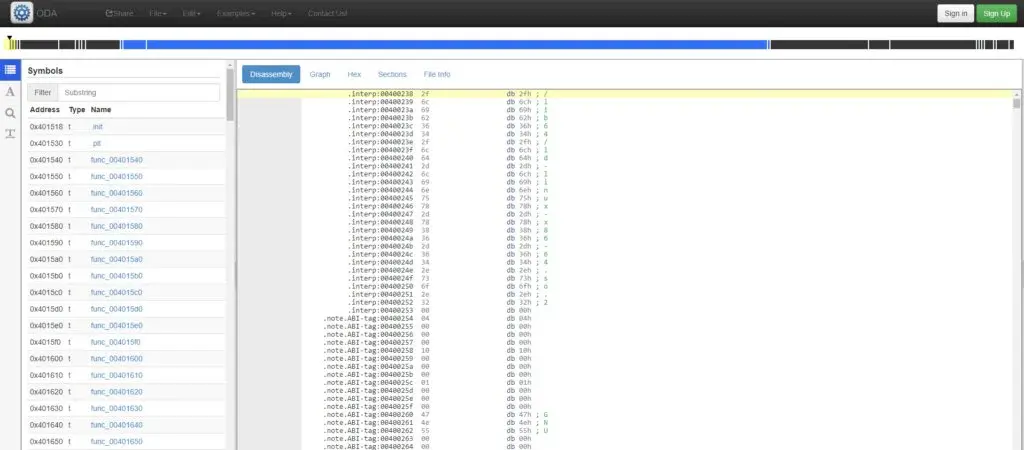
ODA is an online disassembler used for various machine architectures, including AVR, ARM, Alpha, PowerPC, Intel x86, MIPS, Motorola 68000, Z80, SPARC, and many more. Users can upload ELF, Windows, or binary and view the object and disassembly file meta date like sections and symbols. The platform also offers the collaborative reversing experience hosted in the cloud. Users can collaborate on reversing the same binary and share their contributions in real-time with the aid of this fantastic platform. The platform features the most intuitive, user-friendly interface.
The typical disassembly follows the procedure by uploading a file through the menu. After the file has been uploaded, users can annotate and markup the disassembly through keyboard shortcuts and right-click context menus. The collaboration operation requires signing into the ODA platform with a username and password. The platform has some limitations, such as structure definitions do not support the pointer types, file uploads are only 2.5 MB, nested structure definitions are not fully supported, and many more.

X64dbg is a free, open-source assembler-level debugger for Windows. The platform is considered one of the famous malware analysis tools used to step through code while executing and lets users know what it’s doing at the back-end. The tool usually works with compiled assembly code rather than accessing the source code when debugging, which the programmers mostly employ. As the name suggests, the assembly code is low-level programming explicitly designed for 64bit computer architecture.
Most malware analysts rarely start with a debugger. Instead, they start by performing some static analysis first and most likely run the malware in a virtual machine to get some idea of what malware is doing. After the malware has been run on a virtual machine with some behavioral analysis tool, a debugger may be employed to unpack and analyze the functionalities of the malware as a reverse engineering process. The tool has an intuitive and familiar user interface. It provides the users with source code view, thread view, memory map, content-sensitive register view, and many more.

Cutter is a free, advanced, open-source reverse engineering tool keeping the user interface in mind. The tool is created for reverse engineers by the reverse engineers. The platform provides the users with thousands of features by integrating terminal or graphical user interface (GUI). The platform features tons of widgets to be used in the reverse engineering process to make the process as simple as possible. The platform is fully integrated with the native Ghidra decompiler and has no Java.
The platform features multiple modern themes including, Light, Dark, Midnight, and Native. The platform supports the emulation of different file formats. Emulation, unlike debugging, is not executing the binary; instead, it involves emulating instructions. The platform supports both C++ and Python plugins. Cutter has successfully featured in porting radare’s outstanding capability into GUI to compete with Ghidra, BinaryNinja, IDA, and Hopper while remaining free. The platform is a solid tool built on a well-established project, and it should see continual improvements soon.

EDB is a graphical cross-platform x86/x86-64 debugger. The platform was inspired by Ollydbg, which operates on x86 and x86-64 and multiple operating systems. The platform has an intuitive, graphical user interface. The tool also features practical address inspection, more unusual conditional breakpoints, standard debugging operations, fundamental instruction analysis, and many more. It also provides users with a debugging core implemented as a plugin to drop-in replacements. The platform offers an easy-to-use, feature-rich, modern, and straightforward front-end.
The software comes with many unique features like viewing and dumping memory regions, allowing you to watch multiple memory views simultaneously, tabbed data dump view, and effective switch between them. Several plugins are offered through which users can mention hardware breakpoints, code bookmarks, environment variable viewer, the search of binary strings, code analysis engine, open file enumeration, and update checker. The tool was initially designed for Linux; however, it can also be easily ported to other operating systems, like Microsoft Windows and Mac OS X, thanks to Qt SDK.
Binary Ninja is a reverse engineering platform. The built-in decompiler allows users to work with all architectures simultaneously and creates a powerful ILS family known as BNIL. Community architectures can also produce fantastic decompilation apart from the platform’s architectures. The platform offers many open source C++, Rust, and Python bindings. These APIS can easily automate and extend everything from the user interface, types patching, decompilation, and much more.
The platform is built for a pleasant and fast experience, and if the default features don’t suit users’ needs, they can easily use one of the many community themes and customize the hotkeys and layouts. Confidence-based type propagation, code and data cross-references, value-set analysis, and much more can be done automatically through script-based architecture computing fashion. Binary Ninja is a powerful reverse-engineering platform equipped with the most advanced all-in-one essential characteristics and tools for improving user experience and saving time and effort. The program also portrays the disassembly in linear or graph view after it disassembles a binary.

PEBrowseDbg64 Interactive is a free-to-use application that debugs Win64/Win32 executables. It manages (.NET) files and does not use remote debugging architecture. The debugger fully supports Microsoft .NET managed processes and consistently provides the users with mixed-mode and child process debugging. The platform is built on the framework presented by PEBrowse Professional to generate the versatile, very powerful, and customizable Win64 and Win32 user mode disassemblers and debuggers, respectively.
Although the tool is not a source code debugger, it performs at an Intel x86 instruction level, allowing mixed-mode or interop debugging. The platform features an extensive array of breakpoint opportunities like process initialization, module exports, thread startup, debug symbols, module load, JITted (Just-In-Time) method, one-time breakpoints, user-specified addresses, and many more. The usual debugging features include stepping into/overcall statements, single-stepping, running to the next branch instruction, and executing until a selected instruction. The platform also lets users add the breakpoints on a specific IL statement in a .NET managed method.

C[ode]clap is a cross-platform source-level x64 debugger that endeavors to improve and unify the debugging experience on all platforms. All the supported platforms should provide a comparable debugging experience and be considered equal as long as possible. Although the platform is still in the development stages, it offers the best features like a direct view on memory, data breakpoints, inspecting structures and variables, breaking on any code instructions, and editing variables or memory directly.
The platform offers the stepping for source and assembly level debugging, inlined stepping, and stepping over an instruction or source line. The platform is intended to be used solely in a non-critical development environment. It is offered without any warranty, including express or implied, uninterrupted use, fitness, and merchantability of a particular purpose. The platform offers easy and efficient management and allows its users to concentrate on the essential things with an easy-to-use user interface. The tool is compatible with most of the devices dominating the online markets.

RemedyBG is a 64-bit Windows debugger platform written from scratch to replace the behemoth Visual Studio debugger and realize that debuggers have been mainly slack in their progress over the last couple of decades. All the code for the RemedyBG debugger, including the PDB symbol file support engine, is written from scratch. Early access should be considered since the platform is still in development. The platform also has some bugs, and some of the crucial features are still missing, like the text window currently does not include any syntax highlighting.
There are possibilities of adding new features in the newer versions. Repurchasing of the software will not be required as the newer version will be released since the software license is perpetual and source code is not provided as part of the distribution. If users want to create a project in Visual Studio, then one debug/fastlink option will scatter the bits of debug information throughout the LIB and OBJ files rather than storing the data in the PDB file.

Boomerang decompiler is an open-source, general, retargetable decompiler of machine code programs. The platform is developed to create an open-source, real decompiler for machine code programs. A decompile receives an executable file as input and attempts to create a compilable, high-level, maintainable source file that performs the same tasks. The decompiler function is the opposite of the compiler, which takes a source file and makes it executable.
A general decompiler usually doesn’t attempt to reverse every single action of a decompiler. Instead, the program input would be repeatedly transformed until the source code’s result is at a high level. The platform was intended to achieve a retargetable decompiler that can decompile different machine code files with modest effort, e.g., sparc-solaris, x86 Windows, etc. The program was built to be independent of the exact behavior of the compiler that is used chiefly through using robust techniques and transforming the semantics of individual instruction.

Ghidra is a software reverse engineering platform created and maintained by the National Security Agency Research Directorate. The platform features the best high-end software analysis tool and full-featured suite that allows users to analyze compiled code on various platforms like macOS, Windows, and Linux. The popular function that the platform can do include decompilation, graphing, disassembly, scripting, and assembly, along with hundreds of other valuable features.
This tool can run in user-interactive and automated modes and supports various processor-executable formats and instruction sets. The platform also equips users to create customized Ghidra extension scripts or components using Python or Java. In support of NSA’s Cybersecurity mission, the platform was developed to solve the teaming and scaling problems on the complex SRE efforts to provide an extensible and customizable SRE research platform. NSA has employed the platform’s SRE to various problems involving generating deep insights and analyzing the malicious code for the analysts to understand the vulnerabilities in systems and networks better.

IDA is a disassembler capable of creating the maps of execution to show the binary instructions executed by the processor in a symbolic representation of assembly language. The platform features the advanced techniques that have been implemented to generate assembly language source code via machine-executable code. The platform makes the complex code more human-readable through its user-friendly interface. The tool has become standard for analyzing vulnerability research, hostile code, and commercial off-the-shelf validation.
Cross-platform debugging provides the users with easy connection to both remote and local processes, instant debugging, support for 64-bit systems, and possibilities of new connections. The tool allows the users to override its decisions and even provide hints so that the analysts can work quickly and seamlessly with the disassembler and intuitively analyze the binary code in seconds. Fast Library Identification and Recognition Technology (F.L.I.R.T) identifies the standard function calls for various compilers that improve generated disassemblies’ readability and usability.

OllyDbg is an assembler-level analyzing debugger that emphasizes binary code analysis. The platform is precious when the source is not available for debugging. The tool is best suited for debugging the multithreaded applications, providing full UNICODE supports, quickly attachable capabilities to running programs, dynamically recognizing UNICODE and ASCII strings, and more. The platform also supports both IDEAL and MASM formats making it the best configurable disassembler.
The platform has the best intuitive user interface features with no cryptical commands. It allows function description, user-defined labels, and comments. OllyDbg also provides users with an object file scanning function that locates routines from libraries and object files. The platform can understand debugging information written in Borland format and recognizes the complex code constructs, like jumping to the procedure. Users can examine and modify memory, set breakpoints, and pause the program anytime they like. The platform sets logging, conditional, memory, and hardware breakpoints and decodes calls to more than 400C and 1900 standard API functions.

Immunity Debugger is specifically designed for the security industry. It reduces the exploit development time by 50%. The tool provides a powerful and robust scripting language for automating intelligent debugging. It provides fast and lightweight debugging to avoid any corruption during complex analysis. The tool provides connectivity to exploit development tools and fuzzers. The platform’s interface features a command line and graphical user interface (GUI).
The command line would always be featured at the bottom of the GUI for the users. The command line equips the user to type shortcuts as they were in any typical text-based debugger, like GDB or WinDBG. The tool is very light and strives to use as few resources on the system as possible to help optimize the system’s operation. Immunity Debugger’s hook lets users run python scripts on specific programs to determine whether the breakpoint has been hit or any other exception has been caused in the program. The tool offers quick and easy access to the exact program that users wish to analyze.

WinDbg is used for debugging user-mode and kernel-mode, examining CPU registers, and analyzing crash dumps while executing the code. The platform features modern visuals, a full-fledged scripting experience, and faster windows. The tool is built with an extensible object-oriented debugger data model center and front. The modern WinDbg features the same underlying engine, and all the extensions, commands, and workflows still work the same way as before.
The platform has been assisting clients with diagnosing their BSODs and individual program for a very long time. Learning WinDbg requires climbing an expectation to absorb information, and it takes a short time to sort out how things work and figure out how to drive its order substantial interface. Nonetheless, the program will assist users with all of the distinctive dump record types that Windows makes to catch blunder data, and it makes picturing and looking at their substance basic and direct. It is a GUI application that shares little for all intents and purposes with the more notable yet less incredible, Visual Studio Debugger.