
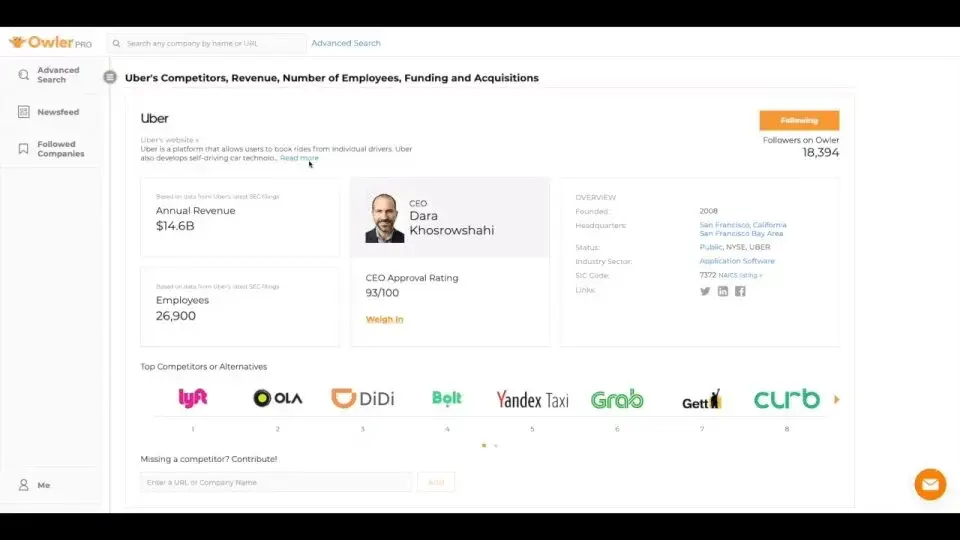
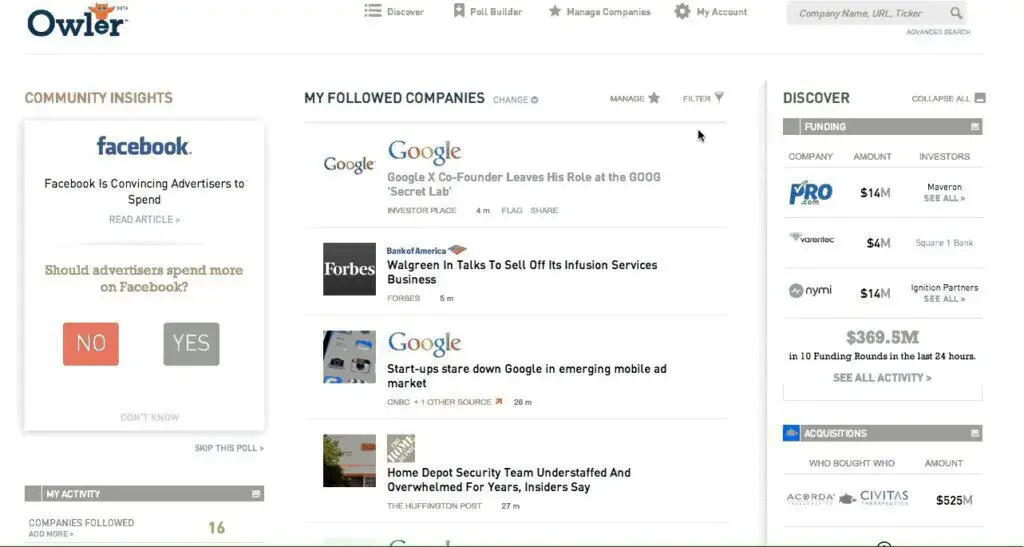
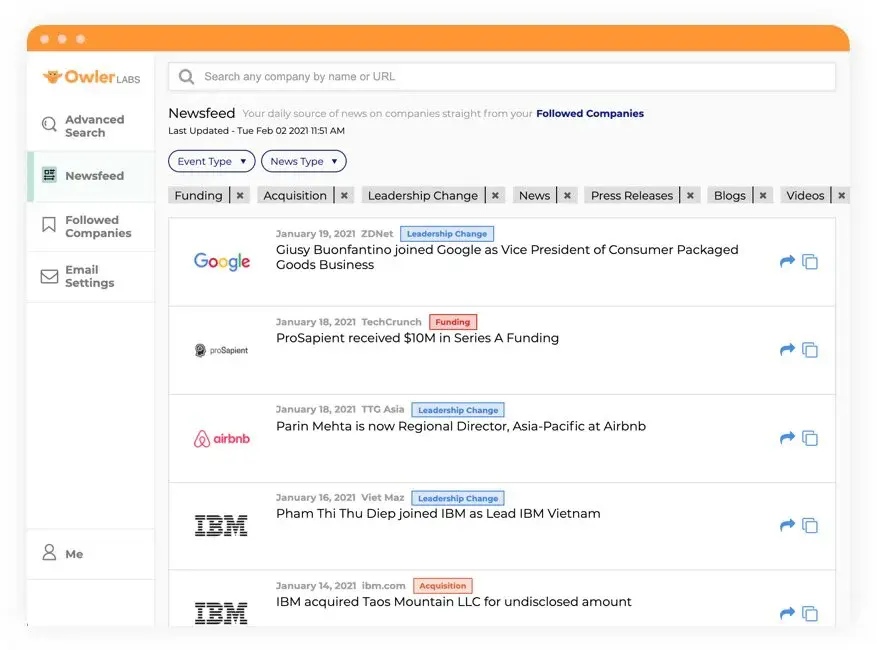
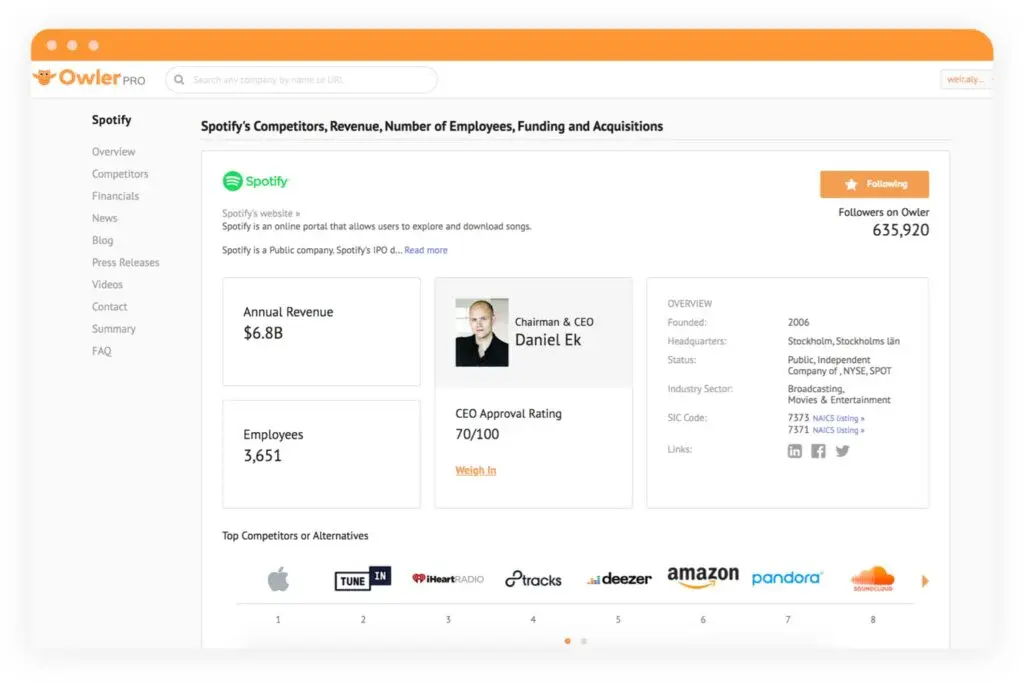
Owler is one of the best web-based applications that can be used to predict and have an idea of market trends and demand for a particular product in the market. This kind of service is highly appreciated by large-scale industries and business organizations as they would know what steps they should take in the upcoming days. These steps help them a lot to follow the market demands and provide services or products accordingly.
This application comes with an interactive and easy-to-understand interface that allows the user to conveniently understand every single value and information of their business or company. This platform also provides analytical reports to the admin user for a better decision to be taken in the future. This is a paid service and the packages can be bought from the official website.
Jaspersoft Studio is a closed source downloadable application that allows the user to easily create, modify, and share files containing large-scale information and data. This is a perfect business solution available for every kind of industry which assists the user to manage the data and information of the organization.
It can be used to create and edit the Jasper Reports. It provides all the features and functionalities which help the admin user to manage every single piece of information including the creation of the report on a weekly as well as monthly basis. It can help the user to create, design, and run reports, build queries, write complex expressions, layout visual components including 50+ types of charts and graphs, maps, tables, crosstabs, and much more.

QlikView is a web-based application available for business administration purposes and can be useful for all kinds and sizes of business organizations. This application provides detailed information about every single asset in an organization by collecting the information and keeping a complete record of everything. This application comes with an interactive interface along with a clean and useful dashboard that can be modified according to own requirements and priorities.
The admin user can easily keep an eye on every asset available and manage them accordingly when required. This platform provides a perfect platform for creating, sharing as well as modifying different report types and information including different charts, graphs, figures, tables and much more. This is a paid service but the charges are affordable when compared to the competitors available in the market.

Ducksboard (now overtaken by New Relic) is one of the most popular business administration and management software solutions available which can be used as a real-time dashboard for all sizes and types of organizations. This application comes with an interactive user interface that communicates with the admin user by providing detailed information about every single aspect of the company.
This application provides help in managing the assets of the company as well as helps the user to keep an eye and complete record of the company’s performance improvement and mistakes so they can be avoided in the future. This application provides the information in many forms including the visual presentation in the form of charts and tables allowing the user to use that information to improve the performance as well as take records for presentation purposes.
SAP Predictive Analysis is a perfect web-based application that provides business solutions for all kinds and sizes of organizations. This is a perfect business suite available on the internet and trusted by thousands of users worldwide. This platform provides all the information and detailed data at a single application without any type of set-up or installing any software on the local hard disk.
This platform facilitates the user by providing the services like information presentation, management assistance, organization of data, and keeping records of sales, costs as well as expenses of the company. All of the information is displayed on the personalized dashboard for the admin user which allows the management department to keep the record of the company’s performance improvements. This is a paid service that can be used at international as well as local level businesses and organizations.
SuiteAnalytics is a web-based application that allows the user to manage the business administration and data management at a single platform easily. This is a business suite offered by worldwide famous company Oracle. This is a perfect application that offers all the basic as well as advanced level features and functionalities allowing the user to use that information for improvement purposes.
The information and data are displayed on this platform in numerous forms and it is presented in a manageable way like in charts, graphs, tables, and others. This presentation helps the administration to understand what actually going on in the company as well as the current situation of cost and profit of the organization. This platform is trusted and being used by thousands of users worldwide covering hundreds of companies and business institutions.
Planamind is a web-based application that allows organizations and business administrations to keep records of their cost and profit and predict the upcoming trends and their demand in the market by using the previous data and information. That information is provided and presented in many ways including charts, tables, and graphs. Many tutorials and how-to videos are provided by experts on the internet for learning purposes.
This platform provides all the information in a dedicated dashboard which is provided on the admin interface allowing him to manage and edit it accordingly. This is a paid application but the trial version is also provided by the company. Presentation of detailed information in this kind of visual format makes it easier for the admin user to understand the data in detail in minimum time.

Biointelli is a cloud-based platform available for business administration purposes and can be useful for all kinds and sizes of business organizations. This platform provides detailed information about every single asset in an organization by collecting the information and keeping a complete record of everything. All the statistical information is provided and presented in many ways including charts, tables, and graphs.
Presentation of detailed information in visual formats makes it convenient for the admin user to understand the data in detail in minimum time. This platform provides all the information in a dedicated dashboard which is provided on the admin interface allowing him to manage and edit it accordingly. The platform also provides an integrated facility with other applications and software solutions.

Entrinsik Informer is a web-based application that helps the business administration department to create reports and predict the demand for a particular product or service in the market depending directly on past data and information. This application comes with an interactive user interface along with a bulk of features and functionalities including data sources, data flow presentations, datasets, reports, discovery, jobs management, tams management, security of information, and extensibility.
This platform provides a complete data hub with millions of rows and database administrations. All the information and data here are provided and presented in a well-managed way that can be used easily for any purpose. All of these mentioned services can be accessed at a single platform without any type of installation of bulky software solutions or switching to numerous applications.

Helical Insight is an open-source downloadable application available that allows the user to easily create reports of detailed information and data. This platform can be used to create data reports and information files which are very important for every type and size of business organization. The interface provided here is easy to understand and simple to use due to its interactive and user-friendly look.
A complete range of features and functionalities is provided on this platform covering every single aspect of the user’s requirements. The options available on this platform include Instant BI, Workflow management, self-service BI, extendable, export capability, multi-tenancy, user and role management, data analysis, 100& browser-based, connections creation, multi-device compatibility, caching, embedding, white labeling, and also the canned reports.
Birst is a business administration and management software solution available that can be used as a real-time dashboard provider for all sizes and types of organizations including education, industries, services providers, and many more. This application is introduced with an interactive user interface that communicates with the admin user by providing detailed information about every single aspect of the company.
The features provided here cover all the minor as well as major requirements of the user including data sources, data flow presentations, datasets, reports, discovery, jobs management, tams management, security of information, and the extensibility of the services. This platform provides all the information in a keen dashboard that is provided on the admin interface allowing him to manage and edit it if required.

FoxMetrics is one of the most popular web-based applications which can be used for business administration purposes. It can be used as a real-time dashboard provider for all sizes and types of organizations including industries, education, IT services providers, etc. This application provides an interactive user interface providing detailed information about every single feature of the company.
The functionalities provided here cover all the minor and major requirements of the user like data sources, data flow presentations, datasets, reports, discovery, jobs management, tams management, security of information, and the extensibility of the services. This platform provides all the information in a keen dashboard that is provided on the admin interface allowing him to manage and edit it if required. This is a paid service and the packages are affordable and can be bought from the official website.

WebKPI is a closed source downloadable software solution available for windows users which allows them to get reports and edit them manually conveniently. This is actually a key performance indicator tool that allows the user to keep an eye on the performance improvement of the company by taking reports that consist of detailed information about the company’s cost, profit, possible demand in the market, etc.
This platform provides all the information in a well-managed way and the information can be further used for different purposes like presenting in a meeting, deriving further information and details by using it as well as working on it according to requirement modifying it if needed. This application comes with an interactive user interface along with all the basic functionalities and features.

Datanyze is a web-based application that facilitates the user by providing services like business intelligence, market trends, demand prediction, and performance reports. This application also helps the user to create and modify as well as share different data and detailed information reports which can be used in formal as well as informal presentations.
The reports can consist of detailed information about some trends inside or outside the organization and the data can be represented in different forms including visual charts, tables, graphs, and other formats. This application comes with an interactive user-friendly interface along with a bulk of features and functionalities which cover all the basic as well as advanced level business needs and requirements of small as well as large scale industries and business organizations.
IBM Cognos Business Intelligence is one of the best and most popular business solutions available in the market nowadays. This is a multi-platform supported application that can be installed and used on Windows servers, LINUX as well as UNIX. This application helps the user to create, modify and share different reports and files containing detailed information and data about the company’s statistics like cost, investments, development ratio, and many more.
This application provides all the information and data on a single platform which allows the user to derive further reports and results depending on this basic data which is directly extracted from the company’s profiles and reports. This advanced engine-based application is highly trusted and is being used by hundreds of companies and organizations across the globe.

Balanced Scorecard is a web-based application that facilitates the user by providing a complete business suite solution for all kinds and sizes of business organizations. It provides a built-in Key performance indicator (KPI) monitor which helps the user to monitor the business’s performance and progress in a better way by using the scales and indicators.
This is a perfect platform that comes with an interactive user-friendly interface along with a complete range of features that cover all the basic level as well as advanced level requirements of an organization no matter what’s the sort and size of the business. This is a paid service but the trial can also be used for learning and trying purposes and the packages are affordable as compared to the competitor application and platforms available in the market.
JPivot is a cost-effective JSP custom tag library that deeply renders an OLAP table and enables the experts to perform typical OLAP navigation such as slice, drill-down, and roll-up. It does not require any Java programming knowledge, and the tags are easy to use. It provides some examples of basic tasks such as filtering, sorting, and grouping data which illustrate employing JPivot’s simple classes in a powerful way.
The key feature of this platform includes getting started using JPivot in your JSPs; you need only three things: the jpivot tag library, an OLAP data source, and an OLAP query. The jpivot tag library has less than 30 function calls, including creating the table and rendering it, and all JPivot tags take an Object parameter; they do not require any Java programming knowledge, creating a table of your data in a JSP page without writing any Java code.

Amazon QuickSight is one of the effective cloud-native businesses intelligence platforms that come with ML integrations, persuading the users to get insights into their business. It is an analytical tool that incorporates data visualization tools, predictive analytics, and data integration into one easy-to-use application. All of your data can now be viewed in native machine learning ML solutions like Kaggle or google XML to see the future of your business.
Amazon QuickSight has the ability to help you make better decisions by giving you valuable insights into your sales, product demand, and risks with actionable recommendations before you take any action. With this platform, you can view your data in different ways, allowing you to easily compare models and make better decisions. You can also choose from a variety of predefined dashboards that will work for many different types of business. It provides any business with insights about their sales performance and their product performance. The Company Performance dashboard uses metrics like revenue growth to determine how quickly you are growing as a company.
Tableau is an easy-to-use platform that is utilized by the top leading organizations or enterprises, ensuring you to visualize the real-time stats of their business performance with a single click. The powerful dashboard allows you to see where your products are on the sales page, how many units are sold per month, lets easy access to advanced features like visualizations, advanced charts and graphics, and collaboration tools so that team members can work together on data analysis projects that require more than one person.
The main advantage of this platform includes You can use the Customer Reviews Dashboard to see if there is an increase in positive reviews after you launch a new advertising campaign. There is also an extensive Community section of the website that contains information about utilizing this analytic software for your business needs. Other function of this platform includes it allows users to collaborate with other users on projects, get help when they need it, and share ideas that might improve their data analysis projects in the future.

DIVE by MIT Media Lab is a web-based data exploration platform that is specially designed for non-technical users, making them create stories from their data without writing code. It helps the professionals to see and understand their data and empower everyone with the ability to connect, visualize, and explore their data for themselves.
With DIVE by MIT Media Lab online, desktop, or tablet, you can perform all kinds of analyses that have been historically difficult or impossible. For example, you can visually explore your network graph for insights before drilling down into a few connections; compare a location-based line graph to a bar chart by dragging one over the other, or even map out your data before asking questions about it using the built-in bin plots. All of this is done through an interface that is incredibly easy to learn, simple to use, and fast.

Apache Superset is an open-source data visualization software that aids companies to perform different important functions like data exploration, data export or import, and others. The adorable function of this platform includes you can instantly decide what data to look at and start making sense out of something, allows you to connect to any kind of data or database, including relational databases, flat files, and cloud-based data sources such as Salesforce.com and Google Analytics dashboards, Create compelling visualizations, stunning, interactive visualizations that tell a story and can be shared easily with others
The interactive graphs allow you to see and understand patterns and relationships that would otherwise take hours or days using traditional tools such as Microsoft Excel. It covers the process of creating visualizations and infographics so they can easily access design insights using only basic graphic design skills. Other function of this platform includes you can https://superset.apache.org/share your created stories with others as HTML5 interactive videos which anyone can view on any device anytime, anywhere.

Telerik Reporting is a next-generation platform that covers the complete set of algorithms, helping you to perform flawless reporting through your web or desktop application. Instead of having to write code to customize their visualizations or share them with others, now you can simply upload your data and change your visualization’s look and feel with predefined templates, and you don’t even need to know HTML, JavaScript, or CSS because Telerik Reporting provides a drag and drop interface for creating beautiful visualizations using simple tools.
Telerik Reporting can now create interactive HTML5 video content with embedded audio and video controls which is not present in any other traditional reporting platform. By utilizing different time-saving methods, you can create custom types of charts, graphs, and maps without writing any code, which means you can build new types of applications in no time flat. Another great feature is the ability to make your application responsive on every browser size.

Chartio is one of the reliable cloud-based services based on Artificial Intelligence, enabling you to analyze data from any business application. It enables developers to create elegant, responsive, and interactive reports with no coding skills required. Developers can use the WYSIWYG design surface in Visual Studio to create reports with advanced interactive features like sorting, filtering, drill-downs, or notifications without writing any code. Reports are easily integrated into your .NET project and deployed by simply adding a reference to them in your VS solution.
With a focus on simplicity and speed-to-value, Chartio’s lightweight dashboards enable everyone to analyze their data from their business applications. Our intuitive interface provides a guided experience that quickly gets you the insights you need. It allows the team to identify any changes in the competitive landscape and make better strategic decisions about sales calls and sales calls targets.

Geckoboard is a platform that persuades you to visualize the key components of your data structure, metrics, and KPIs so that you can understand them with a single click. The main characteristics of this platform include there is a special admin dashboard that creates various metrics, KPIs, and content; custom dimensions are also available in this panel for tracking your company’s internal data. All of your dashboards, widgets, and content can be edited or deleted at any time to test out different ideas or make changes.
With the help of its dashboard viewer tool, it facilitates anyone on the internet to view your dashboard; invite specific people via email, or embed it into a website. Geckoboard has thousands of different widgets that can be used to create meaningful visualizations. The available widgets are organized by the following topics: finance, customers, marketing, sales, and technology. It also has customizable templates for each metric type. You can set up your templates with pre-set background colors or upload your own images for each section of the board.

Ubiq is one of the smart platforms that are fully compatible with fully decentralized applications, tokens, NFTs, and others. Some of the most popular widgets include website visits, sales performance by campaign, and ad spend on Facebook by the campaign on a specific date range. It empowers you to add custom content to your dashboard. This is a great way to highlight specific pieces of information from your business. For example, you might want to include all of the sales team player names and their sales quota for the month on a Sales Performance board.
Custom content can be added directly to the dashboard through the Admin Panel or created and uploaded into the Dashboard Viewer Tools section. Once added, custom content can be re-arranged and used as often as needed. Another function of this platform includes it aids you to create software that makes it easy for people of all ages, backgrounds, skill levels, languages to access cryptocurrency at their fingertips without paying hefty transaction fees.

Sisense is one of the powerful data analytics platforms that comes with end-to-end encryption, making you analyze or visualize any data without any disturbance. It is capable of supporting applications and tokens that require high amounts of storage and computational power to run. These applications need a powerful blockchain solution that ensures message integrity and security while reducing transaction fees and waste of resources. You can use it to collect information from all your sources and unify them into a single repository for effective collaboration or non-complex analysis.
After signing up with Sisense, you are presented with a list of pre-set dashboards that cover the most common business scenarios. You can start using them right away or tweak them according to your specific needs. Another function of this platform includes it utilize customized reports to create customized dashboards. This makes it possible for you to create dashboards that are suited for specific areas.

Alteryx is a multi-function platform that allows you to accelerate the business process like accounting close, tax filings, regulatory reporting, forecast creation, and automate your processes such as reconciliations, consolidations, marketing workflows, system integrations, continuous audits, and many others. It is a suite of data processing, ETL, modeling, and reporting tools for extracting insights from messy data.
Alteryx is an easy-to-use, whether you are an analyst or developer, and works with any type of structured or semi-structured data source, including Microsoft Excel, Oracle, JSON files, and more. To refine data into the perfect format for predictive analyses or prescriptive analytics that can automate important processes within your company. Alteryx also offers connectors for working with popular databases like MySQL or SQL Server, as well as cloud computing platforms like Amazon Web Services (AWS), which enable organizations to create “virtual” environments on AWS where they can host their own database servers and encode their data in a variety of formats.
Phocas is software that comes with business intelligence, helping professionals to perform different tasks like Data Analytics, Financial Reporting, Planning, Budgeting, and Forecasting. It enables organizations to harvest insights from their own data sources, no matter how large or complex, with a simple process that can easily be automated so insights can be discovered on a daily or even an hourly basis.
With tools like Phocas, you can even take your infrastructure code, put it into source control, and run the same configuration across different environments. You can organize all your business information from the most basic to the most complex in a single dashboard view where everyone can see trends and what’s important. In fact, Phocas allows for the integration with Tableau so that it can read all your data from any sources automatically. It has been designed to be both user-friendly and scalable, ensuring that companies can get started immediately and reach their full potential very quickly.

XLCubed is a platform that is based on business intelligence, making the owner of top-leading enterprises or companies in creating dynamic reports, dashboards, and planning solutions. It will help you to optimize P&L, cash flow, and business performance and provide you with insights so that you can make better decisions which in turn will result in a more profitable company. The software development roadmap has many great features on the way, including better collaboration tools, improved dashboards and reporting processes, multiple ways to manage workflows, and more.
With this platform, you can view your data in different ways, allowing you to easily compare models and make better decisions. You can also choose from a variety of predefined dashboards that will work for many different types of business. Other function of this platform includes it allows users to collaborate with other users on projects, get help when they need it, and share ideas that might improve their data analysis projects in the future.
InAppBI is a best-in-class data analytics and integration platform that accelerate the performance of your business and aids you to get insights with a single click. It enables developers to create elegant, responsive, and interactive reports with no coding skills required. Developers can use the WYSIWYG design surface in Visual Studio to create reports with advanced interactive features like sorting, filtering, drill-downs, or notifications without writing any code. It also has customizable templates for each metric type. You can set up your templates with pre-set background colors or upload your own images for each section of the board.
It empowers you to add custom content to your dashboard. This is a great way to highlight specific pieces of information from your business. For example, you might want to include all of the sales team player names and their sales quota for the month on a Sales Performance board.