
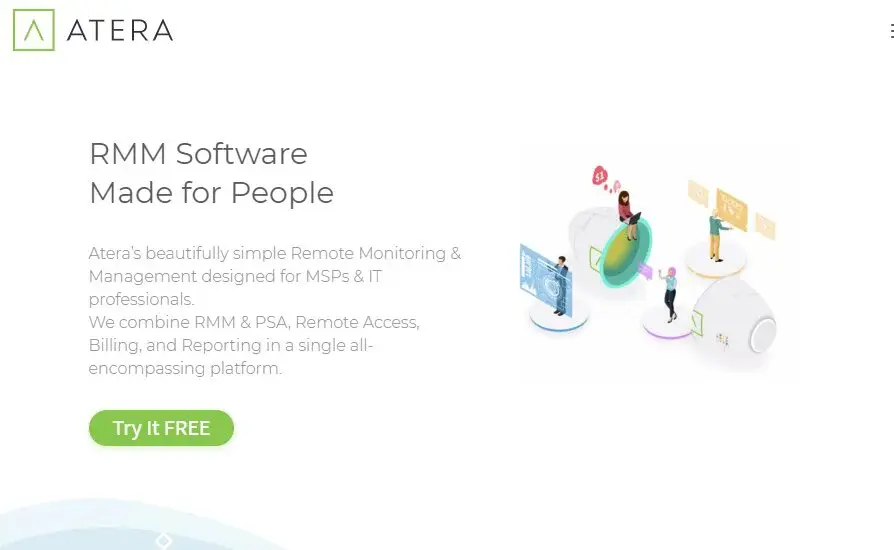
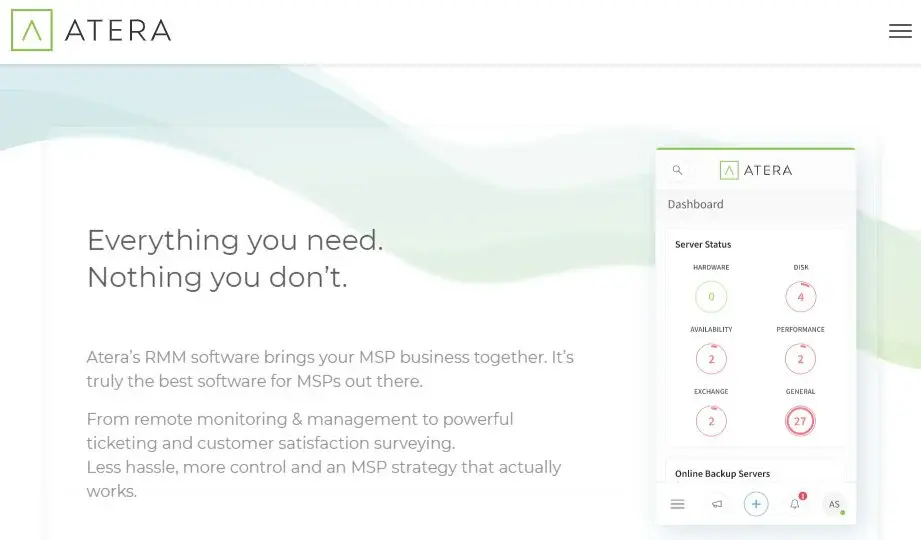
Atera is a platform that comes with a fully integrated, comprehensive technology platform and support services to help IT solution providers more efficiently scale and grow their businesses. The platform combines best-in-class, cloud-based technology with award-winning customer service and has been proven in thousands of customer engagements across hundreds of industries. It facilitates an MSP platform for IT services, with a focus on giving small and medium-sized MSPs the power to run their businesses effectively and efficiently.
It is an all-in-one MSP platform that manages customer service, sales, marketing, and business operations. The AI-based platform is designed to help MSPs efficiently run and grow their businesses with minimal time and effort. The platform is built to deliver the right information at the right time for every customer interaction. In addition, it provides instant access to customer data and activity, enabling you to identify key customer trends and gain valuable insight from every customer interaction.


MRTG is an open-source traffic graphing solution that collects and stores traffic information from routers, switches, and other network devices and then generates HTML, GIF, and PNG network graphs. It collects data from local and remote sources and provides real-time and historical network usage reports. This allows users to identify and diagnose network congestion and performance degradations. It produces daily, weekly, monthly, yearly, and historical network traffic reports for individual network links or groups of links.
With this platform, you can quickly determine which links are overloaded and which are underutilized. By default, it collects data from SNMP-enabled routers and switches. MRTG generates statistics such as the number of packets and bytes received per host per port. It can also create a number of other traffic statistics and can be used to find the busiest part of a network and where bottlenecks are. Nowadays, it is used by a growing number of users from various industries, in various roles, and with various levels of experience.
NEXOG is a multi-vendor management solution that manages any network and every node over multiple protocols, including SNMP and NETCOM, simplifying the tasks of monitoring, managing, and designing. It has a user interface that is easy to use, and the solution is based on a modular architecture that allows fast solutions and deployment of new features requested by customers. It is an integrated information management solution designed to manage, monitor and control all network devices from a single web-based platform.
Its modular design allows users to easily add capacity and manage every aspect of their network. The solution provides an intuitive user interface for IT administrators and enhances the management capabilities of IT staff. It provides valuable information about the health status of the network and allows users to manage the network remotely. It has become a powerful tool for managing any enterprise network and every node over multiple protocols, including WEB-based GUI.
Now that it is adopted by enterprise customers in North America, Europe, and APAC, NEXOG is moving to an open pre-selling model that will let people test the solution without the need of purchasing it upfront. Networks consist of many nodes, which represent a crucial component of the network. These nodes can be anything like a switch, router, NAS, or any other component of the network.

SolarWinds Network Performance Monitor is an enterprise-class network monitoring solution that provides real-time performance monitoring, alerting, and reporting. It enables pre-configured dashboards and reports to help you identify and resolve network performance issues quickly. With extensive prebuilt network device compatibility and out-of-the-box support for monitoring the latest applications, it offers you comprehensive network discovery, configuration, health monitoring, and problem reporting in a single solution.
It is an easy-to-use software that delivers real-time monitoring, alerting, and reporting for routers, switches, and other SNMP-enabled devices. It is a network discovery and network monitoring tool for network management applications such as CRM, helpdesk, asset management, and network operations. SolarWinds Network Performance Monitor automatically discovers network devices in minutes and monitors the network for outages, bottlenecks, and even slow performance. NPM provides real-time performance metrics, historical data reporting, alerting, and alarm notifications to ensure that the entire IT infrastructure is always available.
It’s available as a mobile app to allow technicians to fix problems on-site without having to stay chained to a desktop computer. NPM is a low-cost solution that provides all of the features that technical professionals need to manage their daily tasks. According to the company, its way of handling data is unique because it’s able to handle it at scale with a high level of availability and reliability.

Shinken is an open-source computer system and network monitoring software application compatible with Nagios. It is written in Python, using Oracle Berkeley DB as a back-end data store, and can use either Apache or Nginx as a web front-end. It supports all the main features of the original Nagios core. It includes all the main features you can expect from monitoring software: host monitoring, service monitoring, active checks, passive checks, notifications, etc. The main components of this platform are the shinken-probe and the shinken-master.
It acts as a monitoring tool that gathers data from the monitored hosts. It is a toolbox for storage, visualization, and analysis of time-series data. It provided a common platform for data storage, retrieval, and analysis and aimed at both technical users building their own monitoring applications and the countless people who will never write a line of code in their life but are using applications that need to store and analyze network bandwidth, temperatures, CPU load and more.
RRDtool is one of the efficient open-source tools for Round Robin Database management that can be used to store various types of data, log data or performance data, and display that data in various forms. It is a system used to store and display time-series data and is implemented as a shared library, which means it can be linked into programs or used as a command-line tool. Data is stored in round-robin databases which store the last N measurements for any given value.
It stores more information than other tools, such as the time the value was measured, the minimum and maximum values since the last reset, the lowest and highest values since they were last cleared, the current value of the data, the precision of the calibrated data, etc. It supports a wide range of input plugins for data sources like netsniff-ng, rrdcached, or FitNesse and output plugins including Postgresql/MySQL databases; It comes with the native format for storing on hard disks or any generic script for sending data over to Syslog daemon or e-mail.

NMIS is an advanced network monitoring solution to monitor network up/downtime, traffic, and usage. It is available in three different editions, from free to enterprise. It belongs among the world’s most powerful applications for network monitoring, IP and bandwidth monitoring, system monitoring, and performance monitoring. It can be used for complex, large-scale monitoring scenarios such as network or server farms with many different devices, e.g., routers, switches, firewalls. It offers a complete solution to monitor your internal and external networks, including bandwidth usage and speed on a graphical dashboard.
Additionally, it offers a complete solution to monitor your network with up/downtime monitoring and customizable alerting thresholds. The advanced features for comprehensive network monitoring include real-time and historical traffic analysis, alerts & notifications including via SMS or e-mail or push notifications, remote control, and many more, all from one single dashboard. Therefore it enables its users to monitor their networks in the same way they monitor servers, applications and services by using SNMP, NetFlow, Packet Sniffing, or via web technologies such as HTTP, HTTPS, and FTP.

PRTG Network Monitor is one of the effective platforms that offer up/downtime monitoring, traffic and usage monitoring, packet sniffing, failover clustering, in-depth analysis, and concise reporting. It is specially designed for both small & large enterprises to monitor their network in terms of bandwidth, traffic, and usage monitoring in order to determine the bandwidth consumption of certain networks or users and has also been helpful in understanding application-specific traffic via packet sniffing.
It reveals the status of all your IT infrastructure devices and applications from a single web-based console to help you monitor networks, servers, websites, routers, switches, firewalls, and more from any location in the world. It enables you to collect over 1000 data points per device per minute and monitors network devices for almost any technology, including Windows Server NetBIOS, SNMP, and others.

Datadog Infrastructure is a monitoring service that automates the work of monitoring so that you always have real-time visibility into the health and performance of your infrastructure and applications. It is utilized by the top-class IT, Dev & Ops teams from all over the world, making them collect any data and automatically monitor it. The API Analytics tools help you track your infrastructure and application performance when accessing your systems over API.
Datadog Infrastructure is a SaaS company that makes products that let you monitor your IT infrastructure and applications in real-time. Network monitoring is a daunting task, especially when you want to monitor, control, and report on the performance of your network systems. But if your IT infrastructure is critical to your company’s operations, it’s an area you can’t afford to let slip.
This is especially true for businesses that are heavily dependent on their networks for security, customer service, and a competitive edge. Datadog Infrastructure has developed a solution with the right set of tools and capabilities to monitor your network in terms of uptime, traffic and usage monitoring, packet sniffing, failover clustering, and in-depth analysis.

Paessler PRTG is a smart information technology solution that allows managers to take full control over the networks by monitoring the signals with critical analysis. For taking the free trial version before the final software service, you have to create an account by entering the email, name, country, phone number, and start-up option. The program can be used easily by handling the diverse tasks effectively with shortcut combinations, such as Ctrl-X, Ctrl-C, and Ctrl-V along with mouse navigations, and the intuitive dashboard presents a comprehensive overview of data in the form of graph charts and diagrams.
The multiple servers can be configured at the same time for performing the collective functions and all of them can be handled via PC and major operating systems like Windows, macOS, and Linux. PRTG Desktop has been providing the functions as a substitute edge that you can use to connect to a PRTG core server or a PRTG Hosted Monitor instance to configure your setup, observe the monitoring results, and keep an eye on the entire system.

Ganglia is a scalable distributed monitoring system for high-performance computing systems such as clusters and Grids. The software is based on a hierarchical design, where service monitoring is composed of standalone processes running on all machines in the cluster. The modular structure of this platform ensures scalability to tens of thousands of monitored hosts, plus it has a rich set of features that make it ideal for computing environments. It provides a set of tools for monitoring performance and resource utilization, system monitoring, and control.
It was originally developed to monitor the performance of large-scale clusters, but it is general enough to be applicable in other environments, such as Grids, scientific facilities, data centers, or HPC centers. Ganglia architecture is based on a
client-server model where every node periodically sends statistics to a central server that performs collation and caching. The server then periodically redistributes the statistics it has accumulated to all the other servers. Ganglia is designed to scale up to tens of thousands of nodes. It supports many system resources and platforms, has an intuitive web interface, and is easy to extend via a powerful API.