
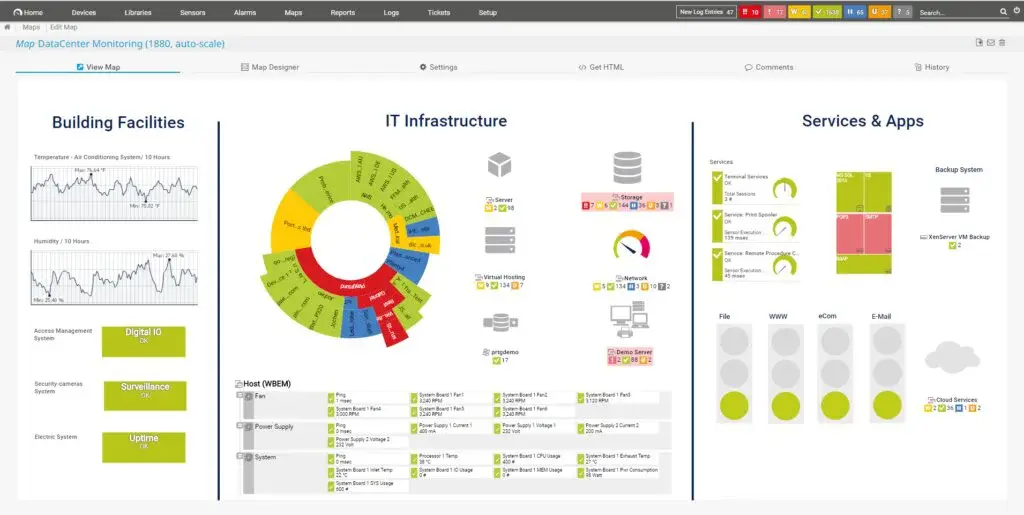
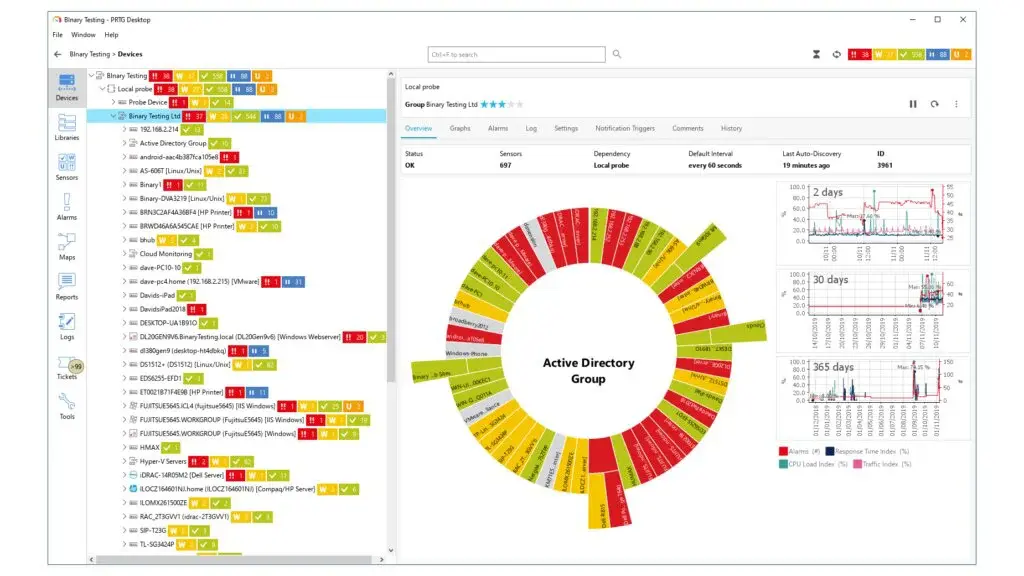
Paessler PRTG is a smart information technology solution that allows managers to take full control over the networks by monitoring the signals with critical analysis. For taking the free trial version before the final software service, you have to create an account by entering the email, name, country, phone number, and start-up option. The program can be used easily by handling the diverse tasks effectively with shortcut combinations, such as Ctrl-X, Ctrl-C, and Ctrl-V along with mouse navigations, and the intuitive dashboard presents a comprehensive overview of data in the form of graph charts and diagrams.
The multiple servers can be configured at the same time for performing the collective functions and all of them can be handled via PC and major operating systems like Windows, macOS, and Linux. PRTG Desktop has been providing the functions as a substitute edge that you can use to connect to a PRTG core server or a PRTG Hosted Monitor instance to configure your setup, observe the monitoring results, and keep an eye on the entire system.


Trafshow is a reliable & intuitive program that helps operators to check the network traffic from all libpcap-capable interfaces to accumulate it in-memory cache by displaying via window line commands. The IP traffic can be aggregated by netmask prefix bits and service ports to reschedule a heap of trivial flows into the treelike hierarchies suitable for human perception and more repositories can be overviewed as well like raw-hex, ascii, and time-stamp. The module has been continually updating various directives for delivering the asynchronous functions from the data collecting with a live show of flows.
All the directives are accumulated to the major display by integrating the diverse features, such as Ethernet, IP, and other virtual protocols. If you have any query and find difficulty understanding anything, then simply press the H button for getting the assistance or can scroll especially via the icon. The users can set the customize features according to their personal needs and the system’s requirements by fetching fast results.

Cacti is a highly customizable network monitoring software that provides global functionalities for managing the signals and traffic over the virtual protocols. It gives robust support to analyze the popular trends regardless of the specific location and has been designed to manipulate the diverse data and stats with well-organized graph-based charts and storage volume.
The major programming language is compatible with diverse gadgets as the PHP or MySQL coding domains and the CPU-based loading commands provide the efficiency for handling the dedicated server and web hosting. There are multiple tasks of the program along with advanced features, such as fully distributed & fault-tolerant data collection framework, unique templates, automation of devices, tress & diagrams, extendable through plugins, domain organizations, language support, LAN-sized installations for complex items, and many others.

Wavemon is a virtual signal detecting program that helps operators to get full control over the diverse modules by engaging multiple channels like data integrations, synchronizations, and clear insights over defined protocols. It has been deployed as a valuable utility and owners of different databases or IT departments can be facilitated with a complete package like watch signal, noise levels, packet statistics, device configuration, parameters, and hardware integrations, etc.
There are basic codes available along with the GitHub repository that allows anyone to make the modifications according to the exact requirements for directing the diverse functionalities. It provides clear pages that highlight the different specifications with described installation protocols and terminal integrations. The tool might be configured with different major systems (though with varying features) with all devices supported by the Linux kernel, and the consoles can be directed simultaneously as well.

Pinguzo is a dynamic networking management program that helps IT, data manipulators, and other net admins to control the diverse number of servers and websites for monitoring the working functionalities. The web tracking helps users to detect the various functions like up & load time, average response times, and all the details are compiled in the form of graphs or diagrams. It provides the complete projection of the hardware device as well, including the CPU, RAM, Disk, Network Usage, and the loading capacity is captured from different locations.
The program can be installed as a lightweight tool and you can stay in touch with alert notifications via e-mail, SMS, PagerDuty, Pushbullet, Slack, HipChat, and web-hooks. It becomes a default tool to provide the comprehensive trends of databases and stats that can be easily understood by non-technical persons as well. The platform can be accessed at any time by providing the email or other queries and you can check the latest performance and optimizations along with other repositories to improve the service.

vnStat is a distinctive network supervising program that allows IT, organizers, to get a detailed overview of the signal domains for managing the virtual database protocols, especially for Linux and BSD systems. It has been providing the services for interacting with a console-based network traffic monitor that keeps a log of linkage traffic for the selected interface(s) without root permissions.
The program is embedded with a robust & comprehensive display provided by the kernel as an information source, and the basic instructions are available as well for reading the context to perform better. The tool doesn’t interfere with sniffing integrations rather it provides the assurance to continue the flexible functionality. There are some valuable features of the utility, such as easy & fast installation, diverse statistics persistence via reboots, multiple interfaces’ tracking, optional png image output, low CPU usage, color configuration editor, and many others.

Nload is a console-based network monitoring tool that is used to deliver categorical insights for checking the virtual connections over the diverse server and web hosting. With the help of the command-line tool, it keeps an eye on network traffic and bandwidth usage in real-time by observing the ongoing and upcoming traffic via proper interface modifications. All the data has been tracked by considering the transfer rate and variations among the linkage usage.
There are basic codes available as an open-source mode that allow anyone to make the modifications according to the exact requirements for directing the diverse functionalities. The tool functions as a lightweight functionality that requires well-renowned operating supports like Linux, *BSD, Solaris, HP-UX, and the most language is described via English version.

Iftop is a smart console-based Linux network bandwidth monitoring tool that provides the complete virtual signals descriptions as a well-organized mode. The program provides the libpcap library for apprehending live network data, and all the activities can be checked via the comprehensive interface. The libncurses provides the highly compiled coding library with a built-in API for building text-based by tracking the interfaces in a terminal-independent way.
For providing the direct instructions to the other repositories, it works as hostnames associated with addresses and counts all IP packets that pass through the filter with a substantial add-on button. The users can set the integrated patterns along with multiple channels by setting domain servers. The tool provides effective functions for engaging with internal specifications of the system and getting an overview of the performance of CPU or RAM. All the traffic is displayed via the table of current bandwidth.

BandwidthD is a fast IPs manipulating platform that assists operators to analyze the various virtual addresses by checking the multiple networking systems to the one centralized forum. It helps users to integrate with the usage of TCP/IP network subnets and builds HTML files with graphs to display utilization. The program has flexible specifications where the abstract address’s utilization can be logged out at intervals of 3.3 minutes, 10 minutes, 1 hour, or 12 hours in pdf format, or to a backend database server.
The tool gets easy configurations via diverse clients, such as HTTP, TCP, UDP, ICMP, VPN, and P2P traffic are color-coded as well, and the functions can be assessed through various modes including Windows. The software is simple & intuitive that provides detailed information of signals and domains in the form of well-defined addresses, files size, storage, P2P transitions, processing rate, loading efficacy, and several others. There are two main output data extracting methods at the moment, first one is the standalone application for dealing with static HTML & PNG mode, and the second is the transferring of data as a backup by a sensor.

BLËSK is an advanced network tracking platform that provides the complete solution for analyzing the various IPs and traffic protocols to improve the latest performance. It is a seamless and highly configurable module that doesn’t cover the complex database connections with ease but also provides effective security plans. A huge number of IT departments, educational institutes, and other organizations have been getting the advantage of the service from a single hub. It is a powerful and robust tool that keeps vast and complex data in the form of entries by deploying the proper tables and log events besides the automatic backup facility without the fixed locations.
With the embedment of digital algorithms and flexible coding, the users can deploy scalable and a high ROI by interpreting the source codes. The rapid detections assist anyone to sort the major or minor network problems along with SNMP traps-based alerts, and internal functionality of the server or desktop can be overviewed as well. The data can be visualized for checking the flow of work through NetFlow, Jflow, and sFlow protocols.

NetVizura NetFlow Analyzer is an ideal solution for internet organizers, especially when they require a tool that can control the virtual networks, bandwidth consumption, traffic trends, domain, servers, interfaces, and other segments. It has been created for users who have to deal with multiple connections in less time, so the program provides a comprehensive interface by visualizing the ongoing or upcoming information in the form of graphs and diagrams.
If you are looking towards the software that might analyze the overall transmissions as a secure mode, then you can consider the forum for checking each component as a forensic test, including anomalies, firewalls, bugs, SIEM events, and other threats, etc. There are some unique utilities available via the main forum for managing the diverse stats and functions, such as Cisco® NetFlow, IPFIX, NSEL, sFlow, and other protocols in the form of highly compiled reports. The following specifications help organizations and IT departs to optimize their abstract channels via diverse network expansion plans along with troubleshooting and diagnostics and improve security options.

IPtraf is a console-based networks detecting tool that provides comprehensive information about the virtual connections by checking the multiple servers and protocols, such as IP, TCP, UDP, ICMP, IGP, IGMP, IGRP, OSPF, ARP, and RARP. It provides an effective and well-organized pattern for analyzing statistics via a comprehensive interface and can be accessed via Linux operating systems. The program covers all the traffic and signals by displaying them as an inclusive module to the main display, and the LAN statistics feature helps discover a host with multiple network packets for port connections of applications.

Darkstat is a cross-platform and fast processing data integrating platform that helps people to get the complete description of network traffic with systematic reports. It is an efficient and smart analyzing module that doesn’t only detect the server reports but also helps operators to compute the statistical usage over the HTTP protocols. The tool approves asynchronous reverse DNS resolution using a basic process and supports the IPv6 protocol for collective information sharing.
It is integrated with web-server with deflate compression manipulations and all the repositories are merged at the central forum for retrieving the collective results. The software is flexible and highly configurable that occupies less space and easily performs functions by interacting with the customize settings. The simple and distinctive interface provides a detailed over of the information and you can analyze the traffic graphs, reports per host & ports for each host in a single process.
SyWatchdog is a cross-checking server platform that provides the collective output results as a data monitoring efficacy by highlighting the positive or negative flaws according to customize options. The main & foremost purpose of creating the module is to provide the all-in-one data detections for improving the existing ongoing performance. It helps net admins to tackle the protocols and virtual connections by directing the repositories as a well-integrated functionality.
The simple interface-based software provides detailed information of signals and domains in the form of well-defined addresses, files size, storage, P2P transitions, processing rate, loading efficacy, and several other domains.
Ethstatus has been specially designed for the networking management system that allows operators and the organizers of Ethernet to tackle the diverse commands with the default interface. The main & distinctive aspect of creating the module is to ensure the provision of multiple statistical databases in a well-organized and systematic way. Different consoles and servers can be easily integrated and configured along with several other tools for exchanging valuable information.
The program works as a console-based observing utility for displaying arithmetical data of the ethernet interface on a quantity basis. With the help of flexible and customizable functions, the users can track the on-going speed of networks, such as ’10’ (=10 Mbps), ‘100’ (=100 Mbps), ’64’ (=64 kbps), ‘128’ (=128 kbps), 256 (=256 kbps), ‘768’ (=768 kbps) or ‘1540’ (=1540 kbps). Moreover, it depends on the requirements to set the variations by maximizing the speed into kilo, mega, Giga, and others.

MRTG is an open-source traffic graphing solution that collects and stores traffic information from routers, switches, and other network devices and then generates HTML, GIF, and PNG network graphs. It collects data from local and remote sources and provides real-time and historical network usage reports. This allows users to identify and diagnose network congestion and performance degradations. It produces daily, weekly, monthly, yearly, and historical network traffic reports for individual network links or groups of links.
With this platform, you can quickly determine which links are overloaded and which are underutilized. By default, it collects data from SNMP-enabled routers and switches. MRTG generates statistics such as the number of packets and bytes received per host per port. It can also create a number of other traffic statistics and can be used to find the busiest part of a network and where bottlenecks are. Nowadays, it is used by a growing number of users from various industries, in various roles, and with various levels of experience.

NEXOG is a multi-vendor management solution that manages any network and every node over multiple protocols, including SNMP and NETCOM, simplifying the tasks of monitoring, managing, and designing. It has a user interface that is easy to use, and the solution is based on a modular architecture that allows fast solutions and deployment of new features requested by customers. It is an integrated information management solution designed to manage, monitor and control all network devices from a single web-based platform.
Its modular design allows users to easily add capacity and manage every aspect of their network. The solution provides an intuitive user interface for IT administrators and enhances the management capabilities of IT staff. It provides valuable information about the health status of the network and allows users to manage the network remotely. It has become a powerful tool for managing any enterprise network and every node over multiple protocols, including WEB-based GUI.
Now that it is adopted by enterprise customers in North America, Europe, and APAC, NEXOG is moving to an open pre-selling model that will let people test the solution without the need of purchasing it upfront. Networks consist of many nodes, which represent a crucial component of the network. These nodes can be anything like a switch, router, NAS, or any other component of the network.

SolarWinds Network Performance Monitor is an enterprise-class network monitoring solution that provides real-time performance monitoring, alerting, and reporting. It enables pre-configured dashboards and reports to help you identify and resolve network performance issues quickly. With extensive prebuilt network device compatibility and out-of-the-box support for monitoring the latest applications, it offers you comprehensive network discovery, configuration, health monitoring, and problem reporting in a single solution.
It is an easy-to-use software that delivers real-time monitoring, alerting, and reporting for routers, switches, and other SNMP-enabled devices. It is a network discovery and network monitoring tool for network management applications such as CRM, helpdesk, asset management, and network operations. SolarWinds Network Performance Monitor automatically discovers network devices in minutes and monitors the network for outages, bottlenecks, and even slow performance. NPM provides real-time performance metrics, historical data reporting, alerting, and alarm notifications to ensure that the entire IT infrastructure is always available.
It’s available as a mobile app to allow technicians to fix problems on-site without having to stay chained to a desktop computer. NPM is a low-cost solution that provides all of the features that technical professionals need to manage their daily tasks. According to the company, its way of handling data is unique because it’s able to handle it at scale with a high level of availability and reliability.

Shinken is an open-source computer system and network monitoring software application compatible with Nagios. It is written in Python, using Oracle Berkeley DB as a back-end data store, and can use either Apache or Nginx as a web front-end. It supports all the main features of the original Nagios core. It includes all the main features you can expect from monitoring software: host monitoring, service monitoring, active checks, passive checks, notifications, etc. The main components of this platform are the shinken-probe and the shinken-master.
It acts as a monitoring tool that gathers data from the monitored hosts. It is a toolbox for storage, visualization, and analysis of time-series data. It provided a common platform for data storage, retrieval, and analysis and aimed at both technical users building their own monitoring applications and the countless people who will never write a line of code in their life but are using applications that need to store and analyze network bandwidth, temperatures, CPU load and more.

RRDtool is one of the efficient open-source tools for Round Robin Database management that can be used to store various types of data, log data or performance data, and display that data in various forms. It is a system used to store and display time-series data and is implemented as a shared library, which means it can be linked into programs or used as a command-line tool. Data is stored in round-robin databases which store the last N measurements for any given value.
It stores more information than other tools, such as the time the value was measured, the minimum and maximum values since the last reset, the lowest and highest values since they were last cleared, the current value of the data, the precision of the calibrated data, etc. It supports a wide range of input plugins for data sources like netsniff-ng, rrdcached, or FitNesse and output plugins including Postgresql/MySQL databases; It comes with the native format for storing on hard disks or any generic script for sending data over to Syslog daemon or e-mail.

NMIS is an advanced network monitoring solution to monitor network up/downtime, traffic, and usage. It is available in three different editions, from free to enterprise. It belongs among the world’s most powerful applications for network monitoring, IP and bandwidth monitoring, system monitoring, and performance monitoring. It can be used for complex, large-scale monitoring scenarios such as network or server farms with many different devices, e.g., routers, switches, firewalls. It offers a complete solution to monitor your internal and external networks, including bandwidth usage and speed on a graphical dashboard.
Additionally, it offers a complete solution to monitor your network with up/downtime monitoring and customizable alerting thresholds. The advanced features for comprehensive network monitoring include real-time and historical traffic analysis, alerts & notifications including via SMS or e-mail or push notifications, remote control, and many more, all from one single dashboard. Therefore it enables its users to monitor their networks in the same way they monitor servers, applications and services by using SNMP, NetFlow, Packet Sniffing, or via web technologies such as HTTP, HTTPS, and FTP.

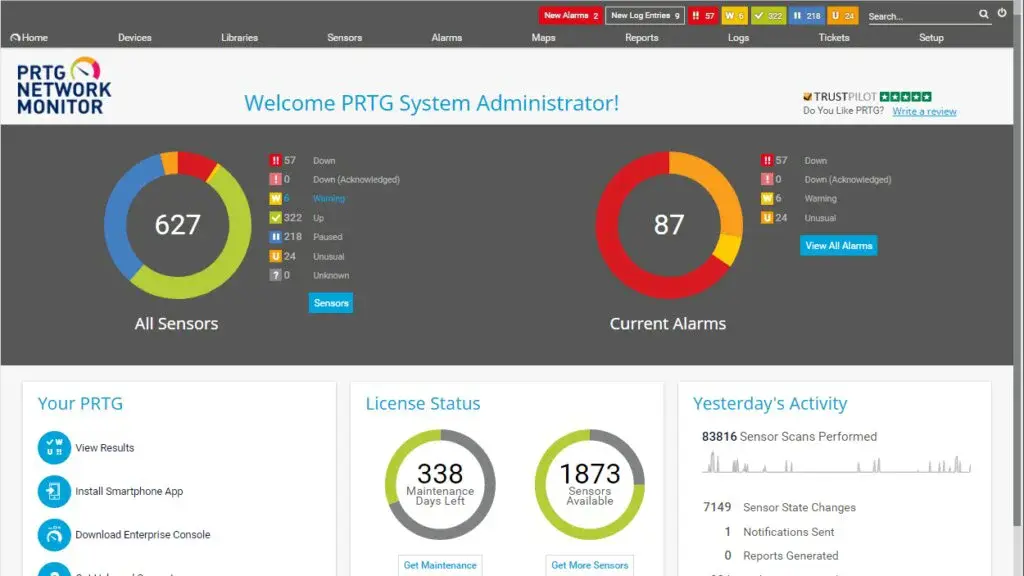
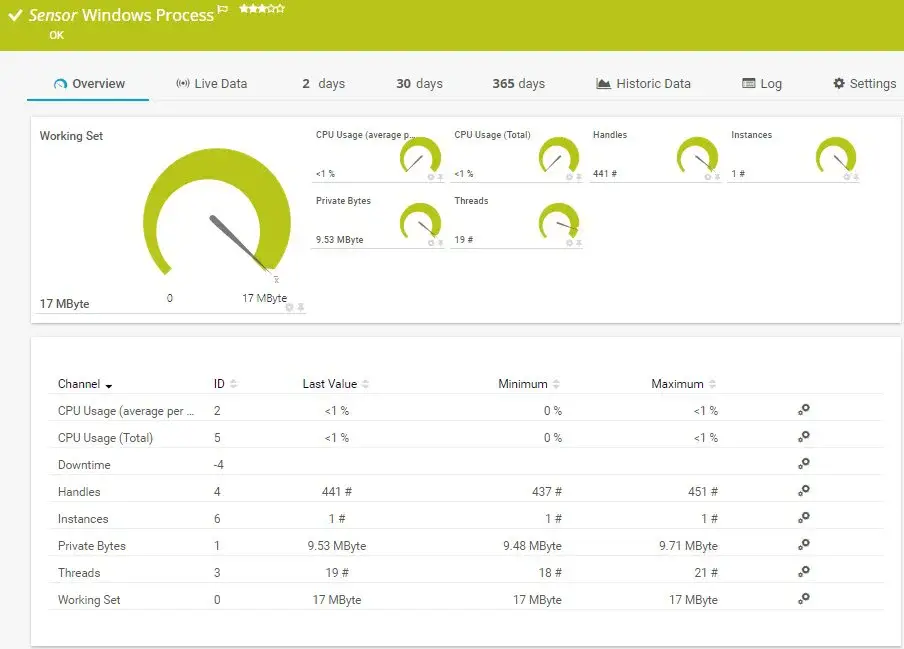
PRTG Network Monitor is one of the effective platforms that offer up/downtime monitoring, traffic and usage monitoring, packet sniffing, failover clustering, in-depth analysis, and concise reporting. It is specially designed for both small & large enterprises to monitor their network in terms of bandwidth, traffic, and usage monitoring in order to determine the bandwidth consumption of certain networks or users and has also been helpful in understanding application-specific traffic via packet sniffing.
It reveals the status of all your IT infrastructure devices and applications from a single web-based console to help you monitor networks, servers, websites, routers, switches, firewalls, and more from any location in the world. It enables you to collect over 1000 data points per device per minute and monitors network devices for almost any technology, including Windows Server NetBIOS, SNMP, and others.

Atera is a platform that comes with a fully integrated, comprehensive technology platform and support services to help IT solution providers more efficiently scale and grow their businesses. The platform combines best-in-class, cloud-based technology with award-winning customer service and has been proven in thousands of customer engagements across hundreds of industries. It facilitates an MSP platform for IT services, with a focus on giving small and medium-sized MSPs the power to run their businesses effectively and efficiently.
It is an all-in-one MSP platform that manages customer service, sales, marketing, and business operations. The AI-based platform is designed to help MSPs efficiently run and grow their businesses with minimal time and effort. The platform is built to deliver the right information at the right time for every customer interaction. In addition, it provides instant access to customer data and activity, enabling you to identify key customer trends and gain valuable insight from every customer interaction.

Datadog Infrastructure is a monitoring service that automates the work of monitoring so that you always have real-time visibility into the health and performance of your infrastructure and applications. It is utilized by the top-class IT, Dev & Ops teams from all over the world, making them collect any data and automatically monitor it. The API Analytics tools help you track your infrastructure and application performance when accessing your systems over API.
Datadog Infrastructure is a SaaS company that makes products that let you monitor your IT infrastructure and applications in real-time. Network monitoring is a daunting task, especially when you want to monitor, control, and report on the performance of your network systems. But if your IT infrastructure is critical to your company’s operations, it’s an area you can’t afford to let slip.
This is especially true for businesses that are heavily dependent on their networks for security, customer service, and a competitive edge. Datadog Infrastructure has developed a solution with the right set of tools and capabilities to monitor your network in terms of uptime, traffic and usage monitoring, packet sniffing, failover clustering, and in-depth analysis.

Ganglia is a scalable distributed monitoring system for high-performance computing systems such as clusters and Grids. The software is based on a hierarchical design, where service monitoring is composed of standalone processes running on all machines in the cluster. The modular structure of this platform ensures scalability to tens of thousands of monitored hosts, plus it has a rich set of features that make it ideal for computing environments. It provides a set of tools for monitoring performance and resource utilization, system monitoring, and control.
It was originally developed to monitor the performance of large-scale clusters, but it is general enough to be applicable in other environments, such as Grids, scientific facilities, data centers, or HPC centers. Ganglia architecture is based on a
client-server model where every node periodically sends statistics to a central server that performs collation and caching. The server then periodically redistributes the statistics it has accumulated to all the other servers. Ganglia is designed to scale up to tens of thousands of nodes. It supports many system resources and platforms, has an intuitive web interface, and is easy to extend via a powerful API.